AAT QDMA using Low Latency IPs Demo Instruction
2.1 IP Address Configuration for Two 10G Ethernet Ports
2.2 Installation of “tcpreplay”
4.3.6 Pricing Engine Submodule
5.2 Download the MCS file via PCIe
1 Overview
This document provides detailed instructions for configuring the Alveo accelerator card and setting up the test environment to run the customized Accelerated Algorithmic Trading (AAT) demo from Design Gateway, called AAT-QDMA. This demo is a modified version of AMD’s original AAT demo, migrated from Vitis to Vivado as the development platform.
Design Gateway offers two AAT-QDMA solutions that integrate Low Latency IPs (LL-IPs):
1) AAT-QDMA with LL10GEMAC-IP: This version integrates only the LL10GEMAC-IP to reduce latency in the Ethernet MAC module. More details of this solution can be found at the following link:
https://dgway.com/products/IP/Lowlatency-IP/ll10gemac-ip-aat-qdma-refdesign-amd/
2) AAT-QDMA-LLIP: This version integrates LL10GEMAC-IP, UDP10GRx-IP, and TOE10GLL-IP in place of AMD 10G/25G Ethernet subsystem, UDP/IP kernel, and TCP/IP kernel. This replacement significantly reduces latency and delivers faster data processing performance. This document focuses on the details of this solution. The datasheets for each IP core are available at the following links:
· LL10GEMAC-IP datasheet
https://dgway.com/products/IP/Lowlatency-IP/dg_ll10gemacip_data_sheet_xilinx_en/
· TOE10GLL-IP datasheet
https://dgway.com/products/IP/Lowlatency-IP/dg_toe10gllip_data_sheet_xilinx_en/
· UDP10GRx-IP datasheet
https://dgway.com/products/IP/Lowlatency-IP/dg_udp10grxip_data_sheet_xilinx_en/
The demo operates on the Alveo accelerator card and demonstrates performance over a 10G Ethernet connection. The Gigabit Ethernet connectors available on each Alveo card vary depending on the model’s capabilities. On the X3522 card, it is equipped with two DSFP28 ports, each supporting up to two 10G Ethernet channels.
In this demo, two 10G Ethernet channels are required:
1) Market Data Transmission: Transmits sample market data using the UDP protocol.
2) Order Transmission: Handles order data transmission using FIX over TCP.
To set up the system, a target PC with two 10G Ethernet ports is required. The sample market data is transmitted using the “tcpreplay” tool, while order reception is monitored by opening a TCP port on the target system. The demo on the Alveo accelerator is initiated by executing the “aat_qdma_dgllip” application.
The following test environment was used to produce the results presented in this document.
1) Supported Alveo cards: X3522.
2) Host system for the Alveo accelerator card: Turnkey accelerator system (TKAS-D2101). Detailed specifications are available at https://dgway.com/products.html#Turnkey.
3) Vivado Design Suite installed on the host system to program the Alveo card.
4) 10G Ethernet cable for X3522:
· Two Ethernet channels by 2xSFP+ Active Optical Cable (AOC):
https://www.10gtek.com/10gsfp+aoc.
· Four Ethernet channels by 2x50G DSFP Breakout DAC:
https://ascentoptics.com/product/50g-dsfp-to-2x-25g-sfp28-breakout-dac-1m.html
5) Programming cable for X3522 card: Alveo Debug Kit (ADK2).
6) Target system is configured with the following specifications.
· Operating System: Ubuntu 22.04 LTS Server.
· Market Data: Sample market data file (cme_input_arb.pcap).
· Packet Replay: “tcpreplay” package for transmitting market data.
· Ethernet Ports: Two 10G Ethernet ports using 10G Ethernet network card.
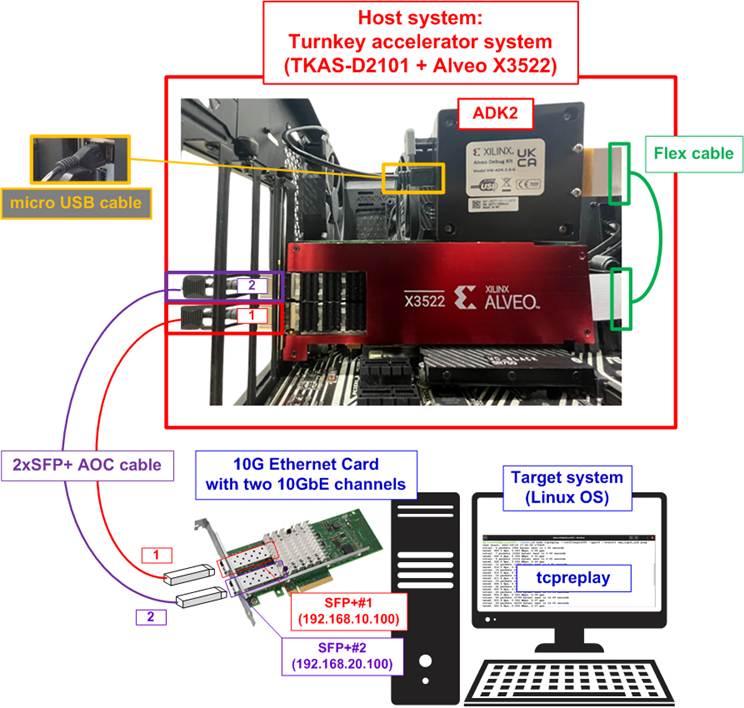
Figure 1 AAT-QDMA-LLIP Demo using Alveo X3522 Card with Two Ethernet Channels
2 Target System Setup
This section provides step-by-step instructions for preparing the target system, equipped with two 10G Ethernet ports, to transfer market data and order packets with the Alveo accelerator card. The system runs Ubuntu 22.04 LTS Server OS.
2.1 IP Address Configuration for Two 10G Ethernet Ports
First, identify the logical names of the two 10G Ethernet ports, which connect to the SFP+#1 and SFP+#2 cables. These logical names may vary based on your test environment, so it is important to configure the correct IP address for the SFP+#1 and SFP+#2 connections.
1) Open a Linux terminal and use the following command to list the logical names of the 10G Ethernet ports:
“lshw -C network”.
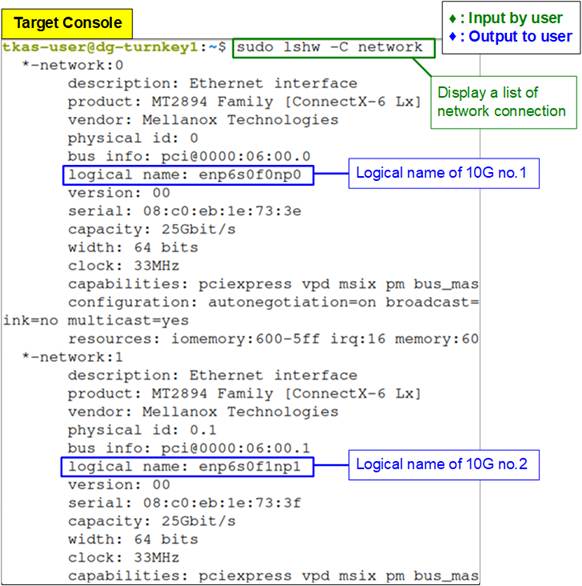
Figure 2 Display Logical Name of 10G Ethernet Ports
The output will display information about the network interfaces. For example, Figure 2 shows logical names such as “enp6s0f0np0” for SFP+#1 and “enp6s0f1np1” for SFP+#2.
2) Configure the IP address for each port using the “ifconfig” command.
· Set SFP+#1 (enp6s0f0np0) to “192.168.10.100”.
· Set SFP+#2 (enp6s0f1np1) to “192.168.20.100”.
Additionally, configure the netmask to 255.255.255.0 (i.e., /24 subnet). The command format is as follows.

Figure 3 Configure IP Address and Netmask
3) After configuring the IP addresses and netmask, verify the settings using the “ifconfig” command.
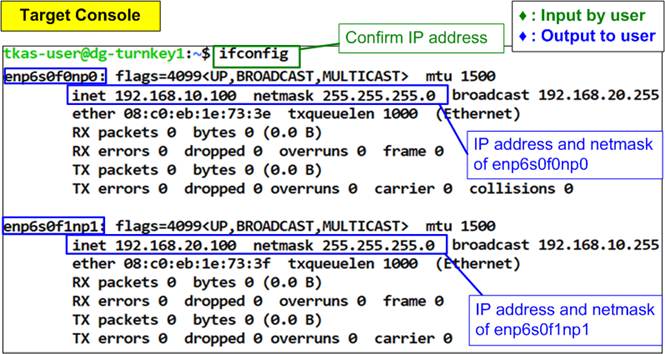
Figure 4 Verify IP Address and Netmask Setting
Ensure that both Ethernet ports are correctly assigned with their respective IP addresses and netmask values.
2.2 Installation of “tcpreplay”
To run the AAT-QDMA-LLIP demo, the target PC must have the “tcpreplay” tool installed, which is used to replay packet capture files over a network interface. Run the following command to install the “tcpreplay” package:
>> sudo apt-get install tcpreplay
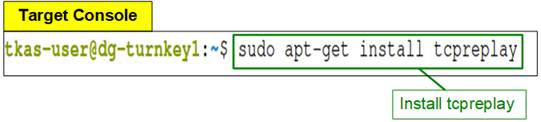
Figure 5 “tcpreplay” Installation
This command will install “tcpreplay”, as illustrated in Figure 5. Once the installation is completed, “tcpreplay” will be ready for use in the demo.
3 Host System Setup
This section outlines the steps to prepare the Turnkey Acceleration System (TKAS-D2101 with an Alveo card), which is the host system for running the AAT-QDMA-LLIP demo.
1) Install QDMA DPDK driver. Since the AAT-QDMA-LLIP demo requires packet transfer through PCIe for the Alveo card configuration, the QDMA DPDK driver must be installed on the host system. The installation guide is available on the AMD website under “QDMA DPDK Driver” on the topic of “Building QDMA DPDK Software”:
https://xilinx.github.io/dma_ip_drivers/master/QDMA/DPDK/html/build.html
2) Connect the Ethernet and programming cable between Alveo card and the target system. The connection details vary slightly depending on the Alveo card installed in the host system. For the X3522 card with two Ethernet channels, follow these steps:
i) Insert two SFP+ transceivers into the SFP+ connectors on the Alveo accelerator card.
ii) Connect SFP+ no.1 (IP: 192.168.10.100) and SFP+ no.2 (IP: 192.168.20.100) to the 10G Ethernet ports on the target system.
iii) For programming the card, connect the Flex cable from the Alveo accelerator card to the Alveo Debug kit (ADK2). Ensure the Flex cable is connected firmly.
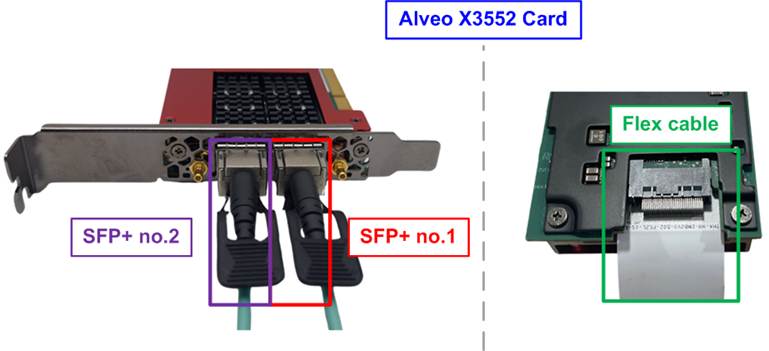
Figure 6 SFP+ and Flex Cable Connection on X3522
3) Utilize the Vivado Hardware Manager to program the Alveo card. Open the Vivado Hardware Manager and program the board with the required bit file as illustrated in Figure 7.
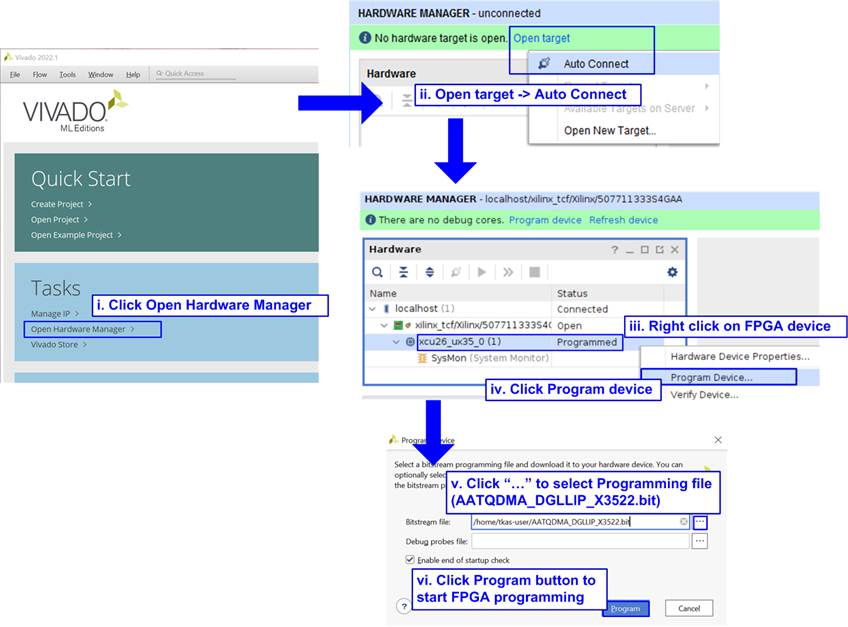
Figure 7 Program Alveo by Vivado Tool
4) Warm reboot the system and confirm that the hardware is implemented on the card using the “lspci” command. The console must display “Network controller: Xilinx Corporation Device 903f” as shown in Figure 8.
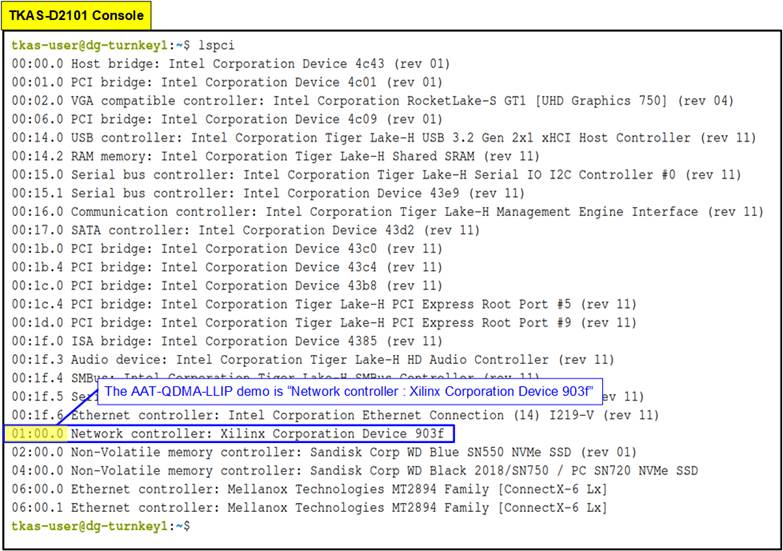
Figure 8 Output of the “lspci” Command After Programming the Alveo Card
5) Bind the previously installed DPDK driver from step (1), with the Alveo card on the host system.
i) Navigate to the “usertools” folder within the DPDK directory:
>> cd <DPDK directory>/dpdk-20.11/usertools
ii) Use the following command to bind the vfio-pci driver to the Alveo card:
>> sudo ./dpdk-devbind.py -b vfio-pci 01:00.0
6) Boot the AAT-QDMA-LLIP demo on the Alveo card by executing the “aat_qdma_dgllip” application.
i) Navigate to the “download” folder:
>> cd <download directory>
ii) Execute the application:
>> sudo ./software/aat_qdma_dgllip
After execution, the DPDK and AAT applications will initialize, as shown in Figure 9.
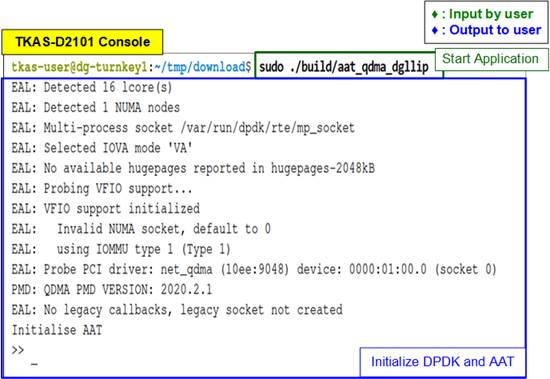
Figure 9 Status Displayed After Executing the Demo Application on the Host System
4 Test Demo
To execute the demo, the user must follow three key steps: Initialization, market data transmission, and test result display. The initialization process establishes the connection and configures the necessary parameters. The market data transmission process involves sending market data from the target system, while the results are received from the Alveo card and displayed on the TKAS-D2101 console. Detailed instructions for each process are provided below.
4.1 Initialization
To run the AAT-QDMA-LLIP demo, both the target system and the Alveo card need to be properly configured. The target must listen on a specific port to receive order packets from the Alveo card, once it has completed processing the market data. Similarly, the Alveo card must be configured to process the market data and send the order packet. This is done using “demo_setup.cfg” or “demo_setup_datamover.cfg” script file. Follow the steps below for system initialization.
1) On the target system’s console, enter the following command to listen on port 12345.
>> nc -l 192.168.20.100 12345 -v
This will configure the target to listen for incoming packets on the specified IP and port.
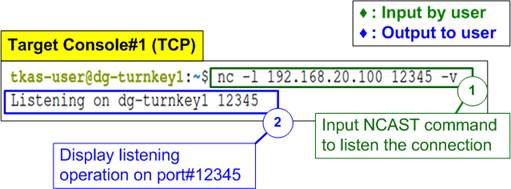
Figure 10 Listen TCP Port on Target PC
2) After entering the command, you should see a confirmation message on the console “Listening on <Target PC name> 12345” indicating that the port is listening, as shown in Figure 10.
3) On the TKAS-D2101 console, run the script file to configure the parameters for processing market data. There are two options for the configuration depending on the implementation of Pricing Engine.
· Configure to implement Pricing Engine on the Alveo card by using “demo_setup.cfg” script file. This method offers more latency reduction for market data processing.
>> run support/demo_setup.cfg
· Configure to implement Pricing Engine on the host software by using “demo_setup_datamover.cfg” script file. This method suits for more complicated algorithm for market data processing.
>> run support/demo_setup_datamover.cfg
Note: The script file can only be executed once after the demo has already been booted up (execute application in step (6) of section 3-Host System Setup). If user requires to rerun the script file, please use “exit” command to cease the demo application and repeat from step (6) of section 3-Host System Setup.
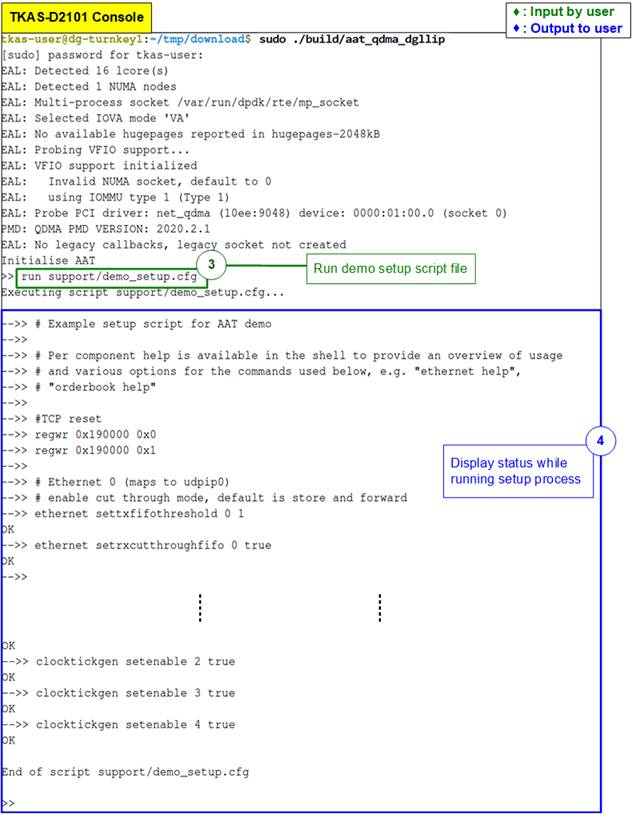
Figure 11 Run Demo Configuration Script (demo_setup.cfg)
4) TKAS-D2101 will display messages during the setup process, as shown in Figure 11. These messages will indicate the progress and status of the configuration process.
5) If the parameter configuration is successful, the target console will display a message indicating that the port has been opened successfully, such as “Connection received on 192.168.20.200 62303”, as shown in Figure 12.
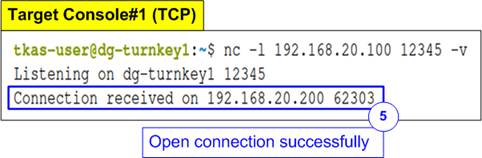
Figure 12 Port Opened Success
4.2 Market Data Transmission
To transmit sample market data, follow these steps using the “tcpreplay” on the target PC. You will need to open two terminal windows on the target PC: Target Console#1 and Target Console#2. Target Console#1 will display the details of the received order packet via TCP protocol (through SFP+#2: enp6s0f1np1), while Target Console#2 will be used to send the sample market data via UDP protocol (through SFP+#1: enp6s0f0np0). Follow the steps below.
1) Send the sample market data. Use the “tcpreplay” command to send the provided sample market data file from AMD AAT demo (cme_input_arb.pcap). Execute the following command on Target Console#2 with the four parameters.
>> sudo tcpreplay --intf1=<eth I/F> --pps=<pac/sec> --stats=<stat period> <replay file>
i) <eth I/F> : Ethernet interface used to send market data (SFP+#1: enp6s0f0np0).
ii) <pac/sec> : Transfer speed, defined as the number of packets per second.
iii) <stat period> : Time interval (in seconds) to display the transmission status on the console.
iv) <replay file> : File name of the market data to be transmitted (e.g., cme_input_arb.pcap).
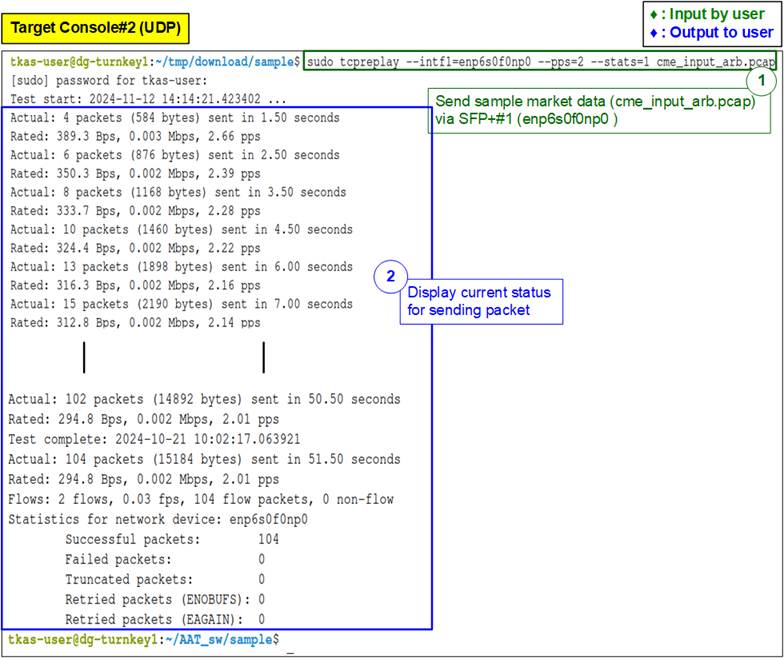
Figure 13 Sample Market Data Transmission by “tcpreplay”
2) As the data is transmitted, the console will display the status every second, showing the total number of packets transmitted.
3) On Target Console#1, which is already connected to the listening port, the console will display the received data. The data represents the sample order packet returned by the Alveo card and serves as the result of the AAT-QDMA-LLIP demo.
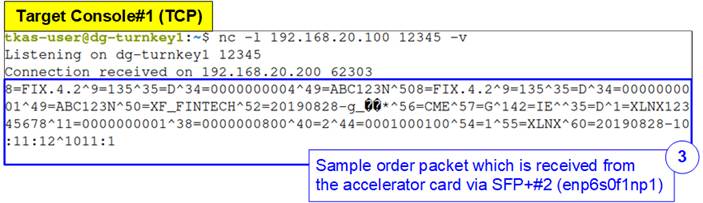
Figure 14 The Sample Data of Order Packet on SFP+#2 Channel
4.3 Market Data Processing
This section presents example results from market data processing on the Alveo card. The AAT-QDMA-LLIP demo design includes a subsystem composed of multiple submodules responsible for processing sample market data.
The discussion focuses on the following key components: Network submodule, Line Handler submodule, Feed Handler submodule, Order Book submodule, Data Mover submodule, Pricing Engine submodule, and Order Entry submodule.
The subsequent sections describe the sample results obtained from these components within the demo design.
4.3.1 Network Submodule
To view the status of the Design Gateway Low Latency IP cores, which consist of LL10GEMAC-IP, TOE10GLL-IP and UDP10GRx-IP, follow the steps below to view the IP status.
1) Enter the following command to display the current status of Design Gateway Low latency IP cores:
>> network getstatus
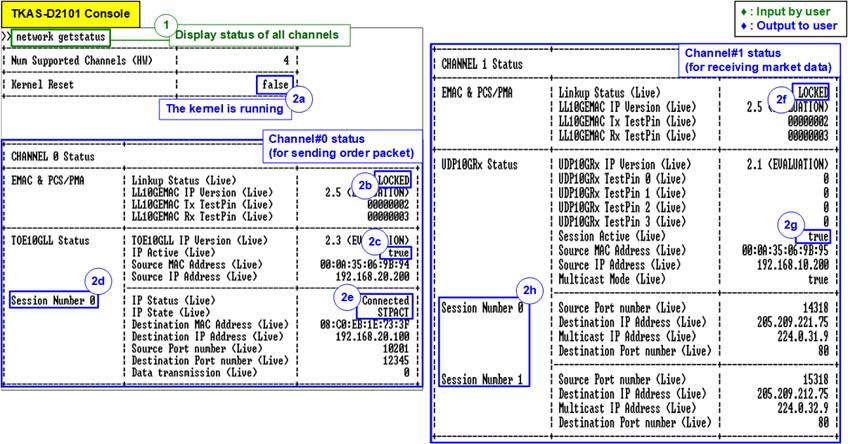
Figure 15 Network Submodule Status
2) After entering the command, the console displays the status information similar to Figure 15. There are four network channels (channel0 – channel3) in the AAT-QDMA-LLIP demo system. This document provides an example where channel#0 is used for returning a sample order packet and channel#1 is used for receiving sample market data. Please ensure that all status values are in a good state.
Main Status
a) Kernel Reset : false
· false : The reset signal of this kernel is de-asserted.
· true : The reset signal of this kernel is asserted.
Channel#0 Status
b) Linkup Status : LOCKED
· LOCKED : The linkup signal of Ethernet MAC is asserted (link up).
· NOT LOCKED : The linkup signal of Ethernet MAC is de-asserted (link down).
c) IP Active : true
· true : The reset signal of TOE10GLL-IP is de-asserted.
· false : The reset signal of TOE10GLL-IP is asserted.
d) Session Number : 0
· Valid range : 0 – 31, indicating the TOE-IP index in the system. This system integrates 32 TOE-IPs for supporting up to 32 TCP sessions.
e) IP Status : Connected
· Initialising : The IP is in reset state.
· Initialised : The IP initialization is complete, but the connection has not yet been established.
· Connected : The TCP connection has been successfully established.
IP State : STPACT
Indicates the TOE-IP state, as defined in Figure 5 and Table 4 of TOE10GLL-IP datasheet.
· STIPRST : Reset state
· STINIT : Initialization state
· STIDLE : Idle state, indicating no active connection
· STAOP : Active open state
· STPOP : Passive open state
· STPACT : Port active state, indicating the connection has already been established
· STACK : Active close state
· STPCL : Passive close state
· STTRST : TCP reset state
· STERR : Error state
Channel#1 Status
f) Linkup Status : LOCKED (detailed description is the same as Channel#0 Status – 2b)
g) Session Active : true
· true : At least one session of UDP10GRx-IP is active.
· false : All sessions of UDP10GRx-IP are inactive.
h) Session Number : 0 and 1
· Valid range : 0 – 15, indicating the UDP session index in the system. This system integrates 4 UDP10GRx-IPs, supporting up to 16 UDP sessions.
Note: Network parameters are configured using a script file, as described in section 4.1.
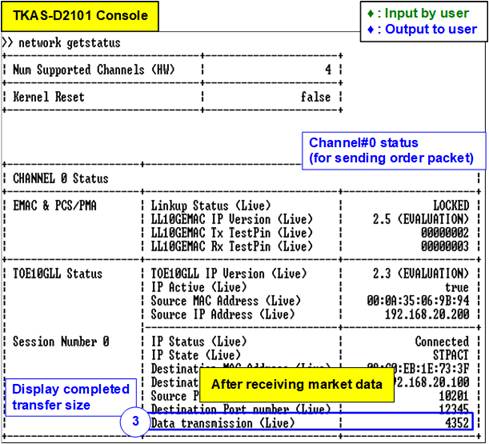
Figure 16 Data Transmission Count Update After Receiving Market Data
3) After transferring the market data, the trade order is generated via Channel#0. The transmitted data counter, showing the total amount of completed data in bytes, is updated as illustrated in Figure 16.
4.3.2 Line Handler Submodule
To view the status of the Line Handler submodule in the AAT-QDMA-LLIP demo system, follow these steps.
1) Enter the following command in the terminal to display the current status of the Line Handler submodule:
>> linehandler getstatus
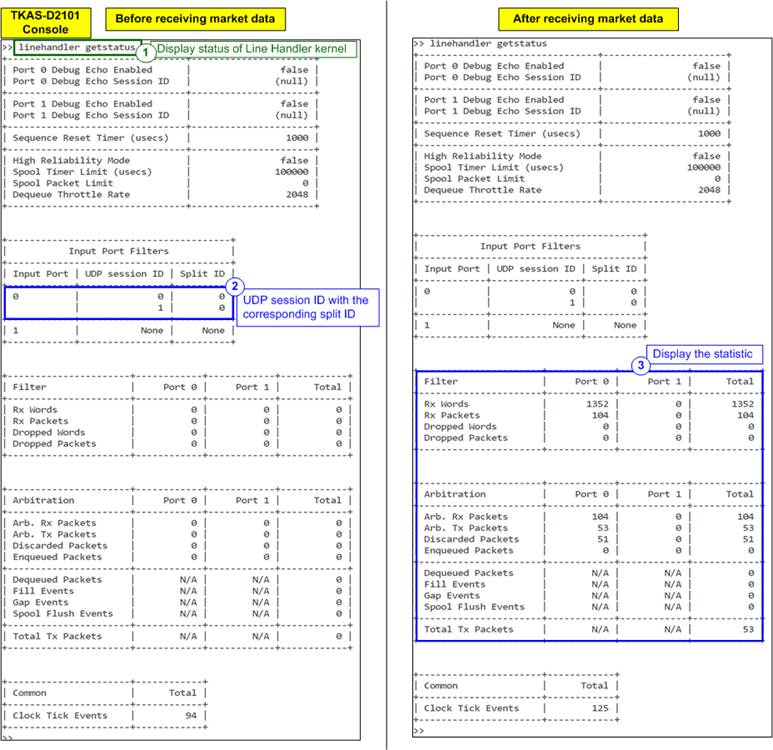
Figure 17 Line Handler Submodule Status
2) After entering the command, the console displays the UDP session with the corresponding split ID.
Note: The AAT-QDMA-LLIP system includes two Ethernet ports for receiving UDP data stream from two sources. In this setup, only one Ethernet port is used. Therefore, Input port#1 shows a “None” status instead of a UDP session ID and its split ID.
3) The console also displays the statistical parameters from the Line Handler submodule. Before transmitting the sample market data, the processed data count is zero. As shown in the right window of Figure 17, once the market data transmission begins, this count increases, indicating that the Line Handler submodule has started processing the market data.
4.3.3 Feed Handler Submodule
To view the status of the Feed Handler submodule in the AAT-QDMA-LLIP demo system, follow these steps.
1) Enter the following command in the terminal to display the current status of the Feed Handler submodule.
>> feedhandler getstatus
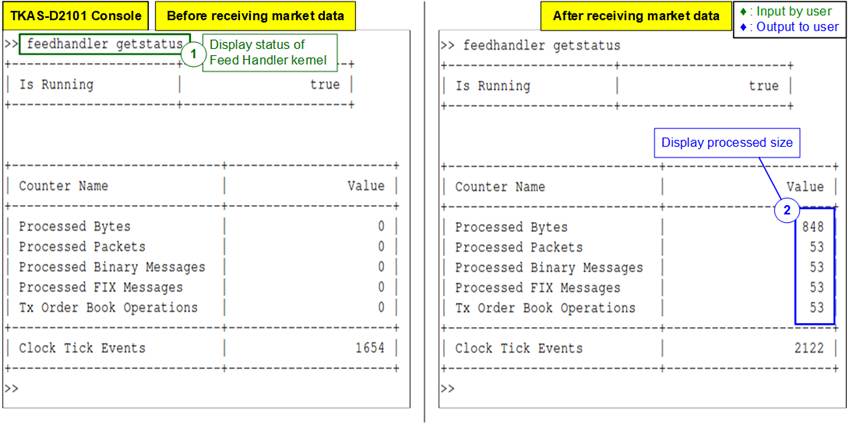
Figure 18 Feed Handler Submodule Status
2) After entering the command, the console displays the count of processed data in various units, such as bytes, packets, and messages. Before transmitting the sample market data, the processed data count is zero. After the market data transmission, this count increases, indicating that the Feed Handler submodule has started processing the market data.
For example, in Figure 18, the left window shows that the processed data count is initially zero. After transmitting the sample market data, the count increases, confirming the submodule is processing the data.
In Figure 13, an example is shown where 104 packets of sample market data were sent by the target PC. Out of these, 53 packets were processed by the Feed Handler submodule, while the remaining packets were rejected.
4.3.4 Order Book Submodule
To view the status of the Order Book submodule in the AAT-QDMA-LLIP demo system, follow these steps.
1) Enter the following command to read and display the current order book output from the Order Book submodule:
>> orderbook readdata
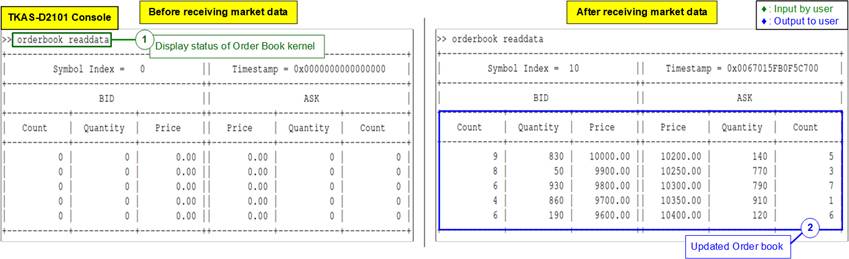
Figure 19 Updated Order Book upon the Processing Completion
2) The console displays the current values in the order book. Initially, before transmitting any sample market data, the order book is in a clean state. However, after the transmission of all sample market data, the Order Book submodule updates the bid/ask quantities and prices in the order book to reflect changes in market conditions.
For instance, in Figure 19, the left window displays the clean status of the order book before the market data is transmitted, while the right window shows the updated order book after all the sample market data has been processed. The bid/ask quantities and prices are adjusted based on the market data, as updated by the Order Book submodule.
4.3.5 Data Mover Submodule
To view the status of the Data Mover submodule in the AAT-QDMA-LLIP demo system, follow these steps.
1) Enter the following command in the terminal to display the status of the Data Mover submodule.
>> datamover getstatus
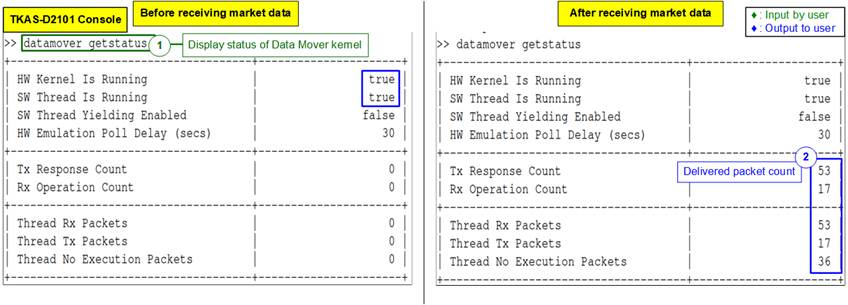
Figure 20 Data Mover Submodule Status
2) The console displays the current status of Data Mover submodule. This Data Mover is active only when the user selects to implement the Pricing Engine by host software (using the “demo_setup_datamover.cfg” file in step (3) of section 4.1-Initialization). Before transmitting the sample market data, the processed data count is zero. After the market data transmission, this count increases, indicating that the Data Mover submodule has started delivering the market data.
Before transmitting the sample market data, ensure that both the software thread and the hardware submodule (hardware kernel) are running:
· HW Kernel Is Running : true
· SW Thread Is Running : true
Note: If the Pricing Engine is configured using “demo_setup.cfg” (implemented on the Alveo card), the statuses of “HW Kernel Is Running” will be true, while “SW Thread Is Running” will be false.
In Figure 20, the total number of packets moved to the Pricing Engine on the host software is 53. After the host Pricing engine completes the processing, the Data Mover receives 17 packets representing the orders to be delivered to the Order Entry submodule. The remaining 36 packets are not executed by the Pricing Engine.
3) To measure the RTT (Round-Trip Time) – defined as the time from when a packet is out from the Data Mover submodule, is processed in the host Pricing Engine, and then order packet returns back to the Data Mover submodule - execute the following command while transmitting the sample market data.
>> datamover timing
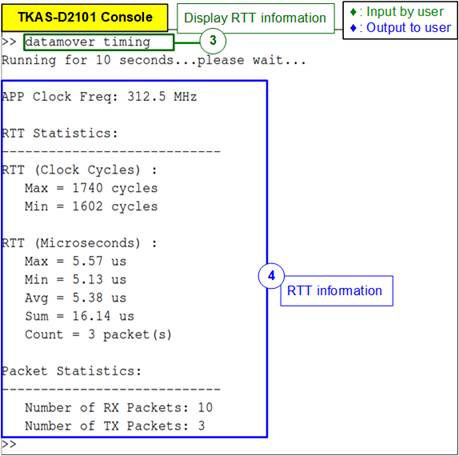
Figure 21 Data Mover RTT Result
4) After entering the command, the measurement runs for 10 seconds. Figure 21 shows the RTT measurement results, including the maximum, minimum, and average values, as well as the total number of sample market data packets collected during the 10-second interval.
4.3.6 Pricing Engine Submodule
To view the status of the Pricing Engine submodule in the AAT-QDMA-LLIP demo system, follow these steps.
1) Enter the following command in the terminal to display the current status of Pricing Engine submodule:
>> pricingengine getstatus
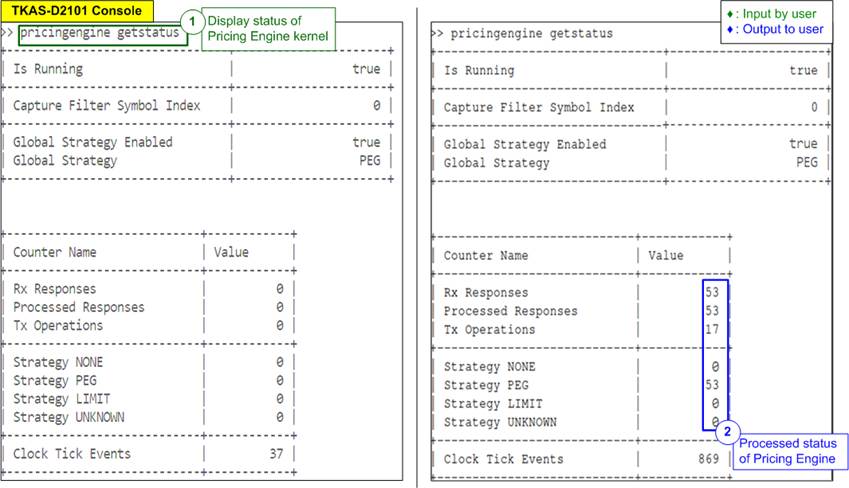
Figure 22 Pricing Engine Submodule Status
2) The Pricing Engine submodule, operating on the Alveo card, is activated only when the user selects to implement the Pricing Engine on the FPGA (by selecting the “demo_setup.cfg” file in step (3) of section 4.1-Initialization). Similar to the other components, before transmitting any sample market data, the Pricing Engine is in a clean state.
As shown in Figure 22, after the market data is transmitted and processed, the Pricing Engine submodule receives 53 data sets from the updated order book. As a result of its computation and algorithm, 17 data sets match the conditions and trigger trading actions, which are then forwarded to the Order Entry submodule as the next step.
4.3.7 Order Entry Submodule
To view the status of the Order Entry submodule in the AAT-QDMA-LLIP demo system, follow these steps.
1) Enter the following command to display the current status of the Order Entry submodule:
>> orderentry getstatus
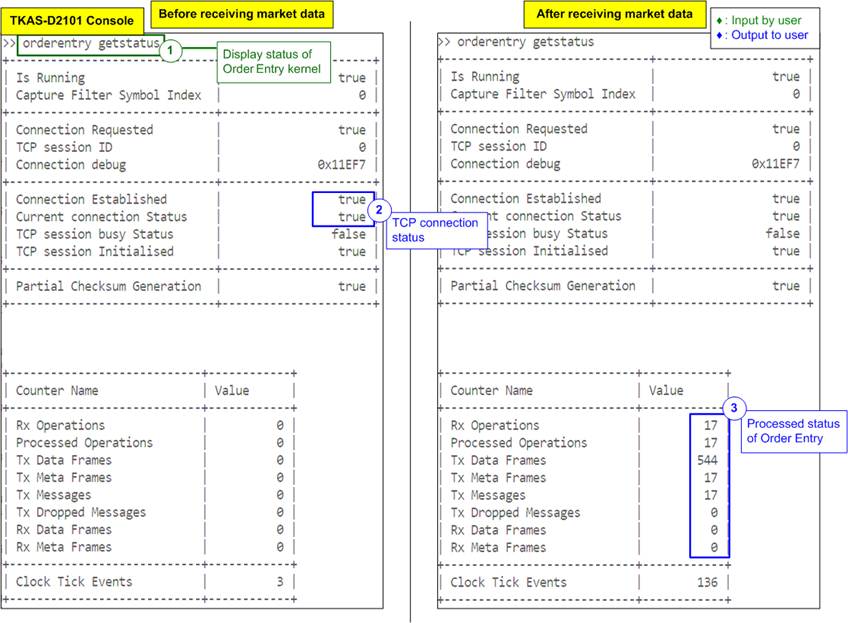
Figure 23 Order Entry Submodule Status
2) Before transmitting the sample market data, check the TCP connection status in the Order Entry submodule status. Two key indicators to confirm are as follows.
· Connection Established : true
Note: If the TCP connection cannot be established successfully, the Connection Established equals “false”.
· Current Connection Status : true
Note: If the TCP connection has been already terminated (no active connection), the Current Connection Status equals “false”.
3) After all market data has been transmitted, the packet count in the Order Entry submodule updates from 0 to reflect the total number of messages or frames processed by the Order Entry submodule.
5 Update Hardware via PCIe
In certain environments, remote hardware updates are necessary. The AAT-QDMA-LLIP includes a hardware module for supporting hardware updates via PCIe, eliminating the need for a programming cable. This section outlines two steps: mcs file creation and download.
For downloading the mcs file via PCIe, the "xbflash2" utility is required. Users can download and install "xbflash2" from the following link:
https://www.amd.com/en/support/downloads/alveo-downloads.html/accelerators/alveo/u50.html
5.1 Create the MCS file
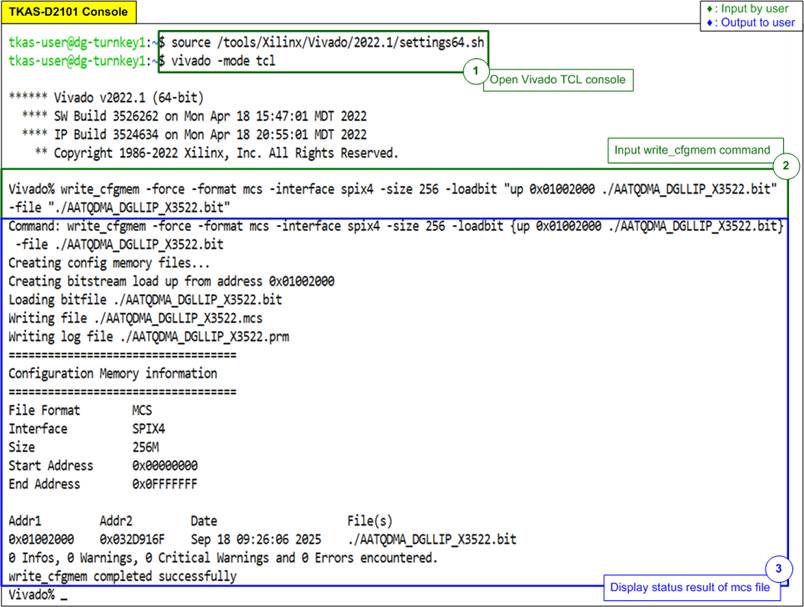
Figure 24 MCS File Creation
1) Open the Vivado tcl console with the following command: “vivado -mode tcl”.
2) Execute the following command to generate the mcs file:
>> write_cfgmem -force -format mcs -interface <interface_type> -size <size> -loadbit “up <user_config_region_offset> <input_file.bit>” -file “output_file.mcs”
Note: The values for “interface_type”, “size”, and “user_config_region_offset” depend on the Alveo card model. For Alveo X3522, use the following:
· interface_type = “spix4”
· size = 256
· user_config_region_offset = 0x01002000
3) After completion, the result is displayed in the console, confirming the successful creation of the mcs file.
5.2 Download the MCS file via PCIe
1) Execute the “xbflash2” utility with root permissions using the following command:
>> sudo xbflash2 program --spi --image <target_mcs_file>.mcs --bar 2 --bar-offset 0x80000 -d <BDF>
Note: The parameters “bar” and “bar-offset” are specific to the default AAT-QDMA-LLIP demo. If the current hardware on the card is not configured with the default AAT-QDMA-LLIP demo, these parameters may need to be adjusted accordingly.
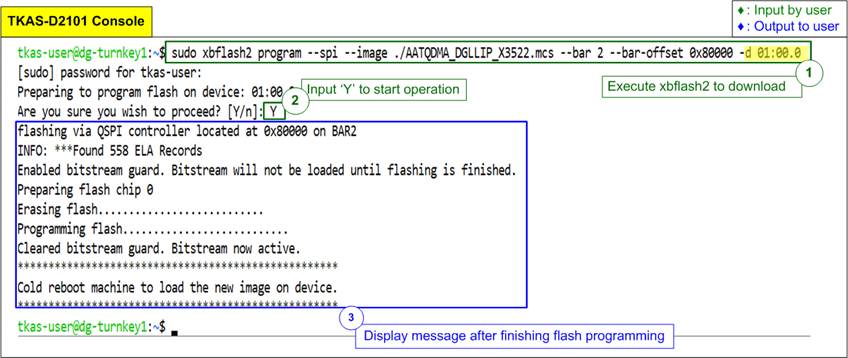
Figure 25 “xbflash2” Programming
2) Enter ‘Y’ to confirm the operation.
3) Wait for the following message to appear on the console:
“Cold reboot machine to load the new image on device”.
4) Perform a cold reboot of the system. After rebooting, the new hardware configuration is permanently applied to the card.
6 Revision History
|
Revision |
Date (D-M-Y) |
Description |
|
1.00 |
23-Sep-25 |
Initial version release |