Random-Access NVMe Host System on PetaLinux
Using rmNVMe-IP Demo Instruction
2 I/O Performance Test with Raw Data
3 I/O Performance Test with Filesystem (ext4)
4 NVMe Management Commands Using DG NVMe Tool
5 User Application Execution via Ethernet Interface
5.1 Configure Ethernet Interface
5.2 Transfer the Executable File
1 Overview
This document provides step-by-step instructions for demonstrating a random-access NVMe host system using the Design Gateway rmNVMe IP Core on a PetaLinux-based FPGA platform. The demo runs on an AMD Zynq UltraScale+ MPSoC evaluation board and is operated entirely through a Linux terminal interface.
The system boots directly from an SD card and is controlled via a Serial console. After booting, users execute prepared terminal commands to evaluate NVMe driver operation, data integrity, and I/O performance. By using the same hardware and software environment while switching between rmNVMe-IP and PCIe-IP configurations, the demo supports two performance profiles:
· PCIe Gen4, using the rmNVMe IP with a PCIe Soft IP for performance-sensitive systems
· PCIe Gen3, using the rmNVMe IP with a PCIe Hard IP for resource-sensitive systems
Two corresponding hardware configurations are provided to support these modes on the evaluation board.
I/O performance is measured using two applications: the industry-standard “fio” benchmark and Design Gateway’s customized “io-uring-perf” application. The performance results, summarized in Table 1, are obtained using an Intel P5800X NVMe SSD and include both raw block device access and filesystem-level access.
Table 1 presents throughput results across multiple access types and operations for PCIe Gen3 and Gen4 configurations.
Table 1 Performance Summary
|
Access Type |
Operation |
I/O Configurations |
Throughput (MB/s) |
|||||
|
Total size |
Block size |
Queue depth |
fio benchmark |
io-uring-perf application |
||||
|
Gen3 |
Gen4 |
Gen3 |
Gen4 |
|||||
|
Raw-device |
Seq Write |
32GB |
32MB |
8 |
3,475 |
4,183 |
3,477 |
6,303 |
|
Raw-device |
Rand Write |
32GB |
32MB |
8 |
3,475 |
4,195 |
- |
- |
|
Raw-device |
Seq Read |
32GB |
32MB |
8 |
3,546 |
5,107 |
3,674 |
5,359 |
|
Raw-device |
Rand Read |
32GB |
32MB |
8 |
3,547 |
5,026 |
- |
- |
|
Raw-device |
Seq Mixed Wr/Rd [50:50] |
32GB |
32MB |
16 |
Wr: 2,518 |
Wr: 2,635 |
Wr: 2,844 |
Wr: 2,904 |
|
Rd: 2,365 |
Rd: 2,475 |
Rd: 2,844 |
Rd: 2,904 |
|||||
|
Filesystem |
Seq Write |
32GB |
32MB |
8 |
3,473 |
4,126 |
3,475 |
6,165 |
|
Filesystem |
Rand Write |
32GB |
32MB |
8 |
3,473 |
4,078 |
- |
- |
|
Filesystem |
Seq Read |
32GB |
32MB |
8 |
3,548 |
5,048 |
3,674 |
5,304 |
|
Filesystem |
Rand Read |
32GB |
32MB |
8 |
3,547 |
5,045 |
- |
- |
|
Filesystem |
Seq Mixed Wr/Rd [50:50] |
32GB |
32MB |
16 |
Wr: 2,590 |
Wr: 2,589 |
Wr: 2,610 |
Wr: 2,613 |
|
Rd: 2,430 |
Rd: 2,432 |
Rd: 2,610 |
Rd: 2,613 |
|||||
This document is organized into five main sections. Sections 2 and 3 describe I/O performance evaluation using raw block device access and filesystem-level access, respectively. Section 4 introduces the usage of miscellaneous NVMe management commands supported by the rmNVMe-IP, including Identify, SMART, Flush, Secure Erase, and Shutdown. The final section demonstrates how to run a user application on the FPGA board via the Ethernet interface, allowing users to validate the system with their own applications.
Before running the demo and performance tests described in the following sections, users must first prepare the hardware platform and boot the system. The next part of this document therefore begins with the FPGA board setup and system initialization process.
To prepare the demo environment, follow the hardware setup instructions provided in the “NVMeG4IP-dmalinux-fpgasetup-amd” document:
https://dgway.com/products/IP/NVMe-IP/NVMeG4IP-dmalinux-fpgasetup-amd/
This setup process includes hardware connections, SD card preparation, and FPGA configuration. Once the FPGA boots successfully from the SD card, a login prompt appears on the Serial console, as shown in Figure 1. Log in to the Linux system using the following credentials:

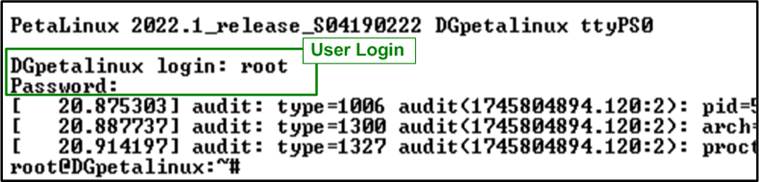
Figure 1 Login Window
After logging in, users must first verify that the rmNVMe driver module and the NVMe device have been properly installed and initialized. This system verification step is required before proceeding with any performance tests or benchmark operations.
1) First, check that the rmNVMe driver module has been successfully loaded by running the following command in the terminal:
![]()
This command lists all kernel modules currently loaded in the system. Confirm that the “dg_rmnvmedrv” module is present, which indicates that the rmNVMe driver for the NVMe interface has been successfully loaded, as shown in Figure 2.
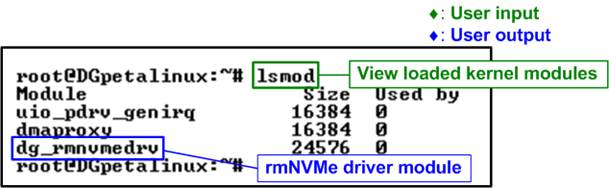
Figure 2 Drivers Loaded in the System
2) Once the driver module is confirmed to be active, verify that the NVMe block device has been detected and that the corresponding device node has been created. Run the following command in the terminal:
![]()
If the NVMe device is correctly initialized, the console displays the device node “/dev/dgnvmeblk0”, indicating that the system is ready to access the NVMe device, as shown in Figure 3.
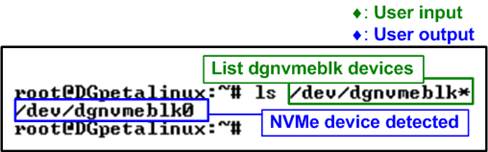
Figure 3 NVMe Device Detected
If the NVMe device fails to initialize or is not properly connected, the command returns the following error message: “ls: cannot access ‘/dev/dgnvmeblk*’: No such file or directory” as shown in Figure 4. In such cases, users should recheck the hardware connections and FPGA configuration before continuing.
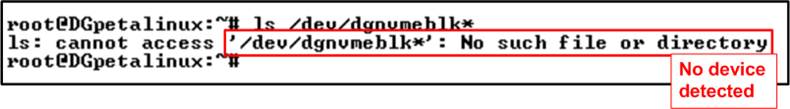
Figure 4 NVMe Device Not Detected
Once the system verification is completed successfully, users can proceed to checking the I/O capabilities of the NVMe block device prior to running benchmarks.
Before running performance benchmarks, it is important to verify the I/O capability of the NVMe block device in the Linux system to ensure optimal performance.
1) Maximum I/O transfer size per request: This parameter represents the largest data size that can be transferred in a single I/O request. In this demo, a value of 1024 KB indicates a maximum transfer size of 1 MB per request. To check this value, run the following command in the terminal:
![]()
2) Number of tags per hardware queue (HW Queue): These values indicate the maximum number of outstanding I/O commands supported by each hardware queue. In this demo system using rmNVMe-IP, HW Queue 0 corresponds to the write queue and HW Queue 1 corresponds to the read queue. Both queues are configured with 256 tags
To check the number of tags for each hardware queue, run the following commands in the terminal:
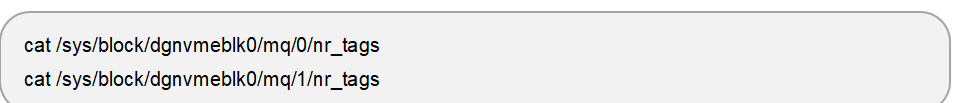
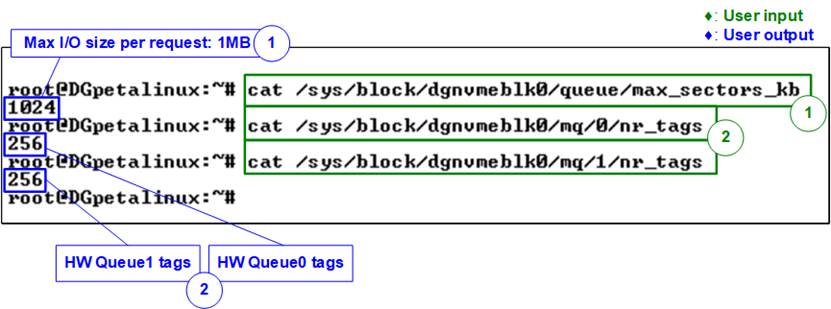
Figure 5 Maximum I/O Size and Hardware Queue Tag Count of Block Device
The parameters described above—including the maximum I/O transfer size and the number of tags per hardware queue—define the I/O limits and queue configuration used in the subsequent performance tests. These values should be verified before running any benchmarks to ensure consistency between the hardware configuration and software settings. Skipping this verification may result in suboptimal performance.
To achieve performance close to the system’s maximum capability, the block size (bs) should be set to at least the value of max_sectors_kb (1 MB). In addition, the total outstanding data size, calculated as bs × iodepth, should not exceed max_sectors_kb (1 MB) × nr_tags (256). This configuration ensures efficient utilization of the hardware queues while avoiding queue saturation, which can otherwise introduce additional latency due to software requeue operations.
Note: These parameters are defined by the hardware DMA module and are independent of the NVMe SSD characteristics. In this demo setup, the maximum I/O size is fixed at 1 MB, and both HW Queue 0 and HW Queue 1 are configured with 256 tags.
2 I/O Performance Test with Raw Data
This section demonstrates I/O performance testing on the NVMe block device with raw data access. The tests are performed directly on the block device node (e.g., /dev/dgnvmeblk0) to measure the throughput achievable by the rmNVMe driver and hardware. Performance is measured using both the fio benchmark and the io-uring-perf application.
Before running the tests in this section, users should verify the I/O capabilities of the NVMe block device in the Linux system to ensure optimal performance, as described in the previous section and shown in Figure 5.
2.1 fio Benchmark
In this subsection, the fio benchmark is used to evaluate raw device I/O performance under various access patterns. The test scenarios include Sequential Write, Random Write, Sequential Read, Random Read, and Mixed Write/Read operations.
2.1.1 Sequential Write
This test writes a total of 32 GB of data using a 32 MB block size and an I/O depth of 8. The workload performs a sequential write operation using the io_uring I/O engine with direct I/O enabled, targeting the block device /dev/dgnvmeblk0. The test is executed using the following command:

Figure 6 shows the result of the sequential write test executed with the fio benchmark. The upper portion of the figure displays the command execution and real-time progress output, while the lower portion presents the final performance summary. In this example, a write bandwidth of 4183 MB/s is achieved.
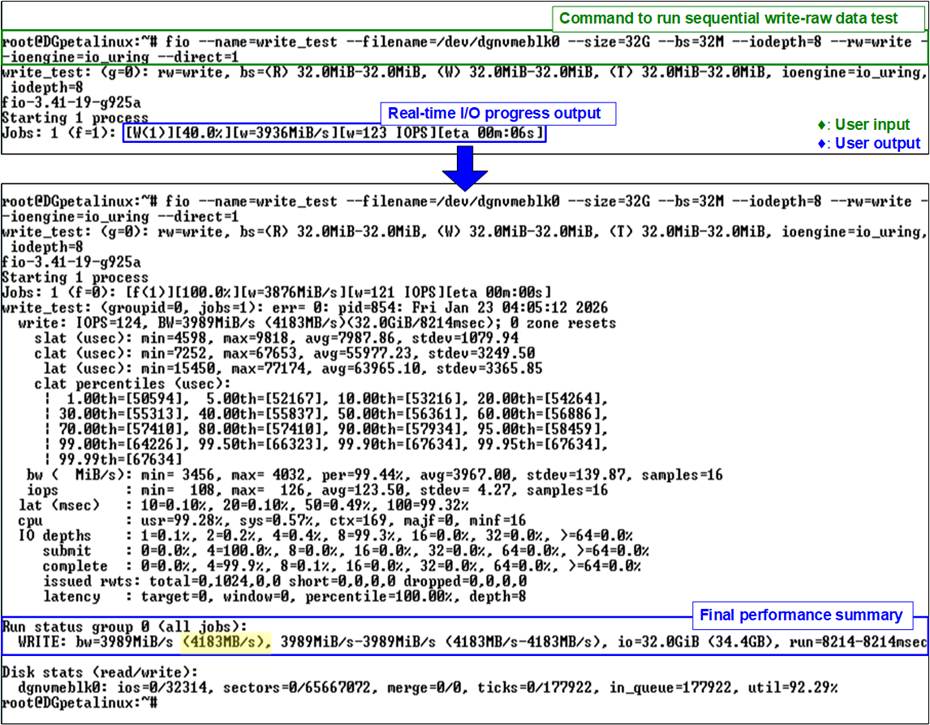
Figure 6 fio Sequential Write Test (Gen4 Speed)
2.1.2 Random Write
This test writes a total of 32 GB of data using a 32 MB block size and an I/O depth of 8. The workload performs a random write operation using the io_uring I/O engine with direct I/O enabled, targeting the block device /dev/dgnvmeblk0. The test is executed using the following command:

Figure 7 shows the result of the random write test executed with the fio benchmark. The upper portion of the figure displays the command execution and real-time progress output, while the lower portion presents the final performance summary. In this example, a write bandwidth of 4195 MB/s is achieved.
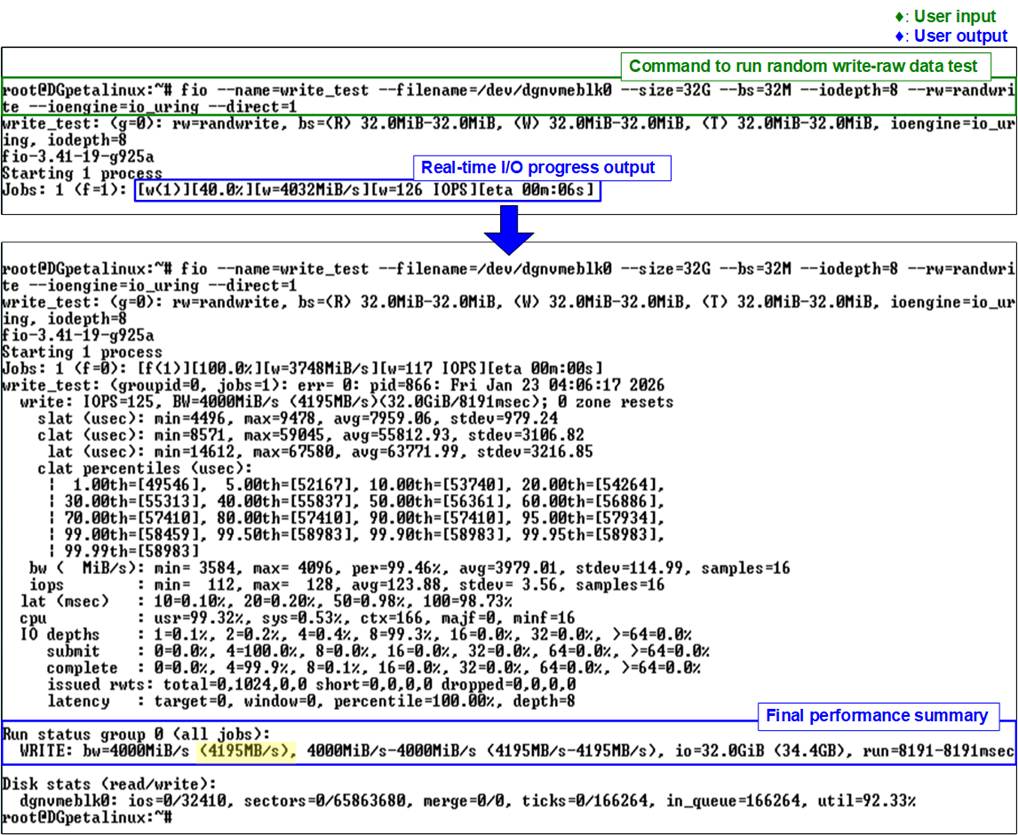
Figure 7 fio Random Write Test (Gen4 Speed)
2.1.3 Sequential Read
This test reads a total of 32 GB of data using a 32 MB block size and an I/O depth of 8. The workload performs a sequential read operation using the io_uring I/O engine with direct I/O enabled, targeting the block device /dev/dgnvmeblk0. The test is executed using the following command:

Figure 8 shows the result of the sequential read test executed with the fio benchmark. The upper portion of the figure displays the command execution and real-time progress output, while the lower portion presents the final performance summary. In this example, a read bandwidth of 5107 MB/s is achieved.
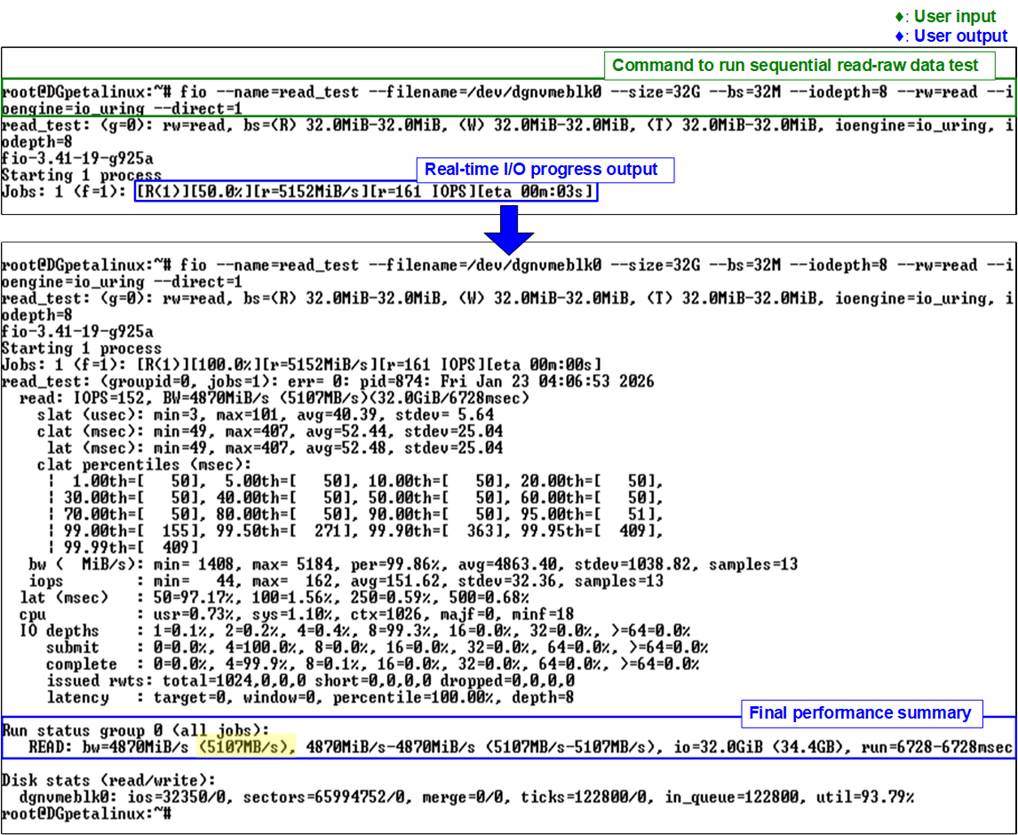
Figure 8 fio Sequential Read Test (Gen4 Speed)
2.1.4 Random Read
This test reads a total of 32 GB of data using a 32 MB block size and an I/O depth of 8. The workload performs a random read operation using the io_uring I/O engine with direct I/O enabled, targeting the block device /dev/dgnvmeblk0. The test is executed using the following command:

Figure 9 shows the result of the random read test executed with the fio benchmark. The upper portion of the figure displays the command execution and real-time progress output, while the lower portion presents the final performance summary. In this example, a read bandwidth of 5026 MB/s is achieved.
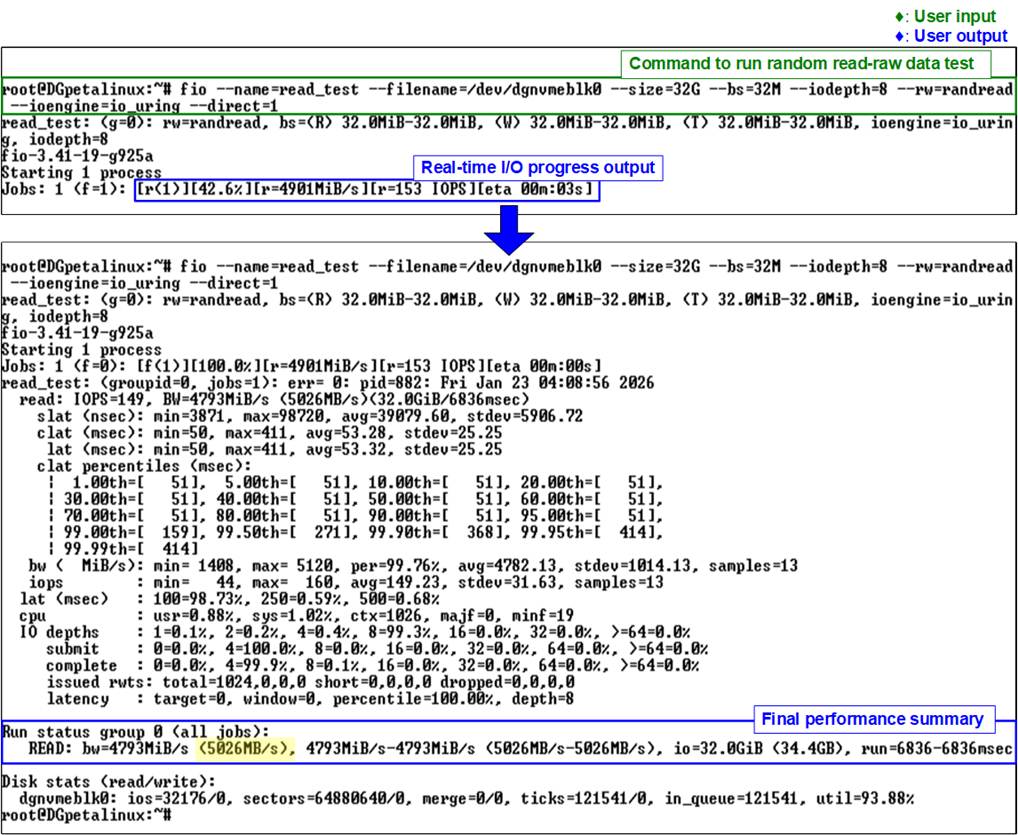
Figure 9 fio Random Read Test (Gen4 Speed)
2.1.5 Mixed Write/Read
This test performs a mixed write/read workload with a total data size of 32 GB using a 32 MB block size and an I/O depth of 16. The workload executes a mixed write/read operation using the io_uring I/O engine with direct I/O enabled, targeting the block device /dev/dgnvmeblk0. The test is executed using the following command:

Figure 10 illustrates the results of the mixed write/read test executed with the fio benchmark. The results report a write bandwidth of 2635 MB/s and a read bandwidth of 2475 MB/s.
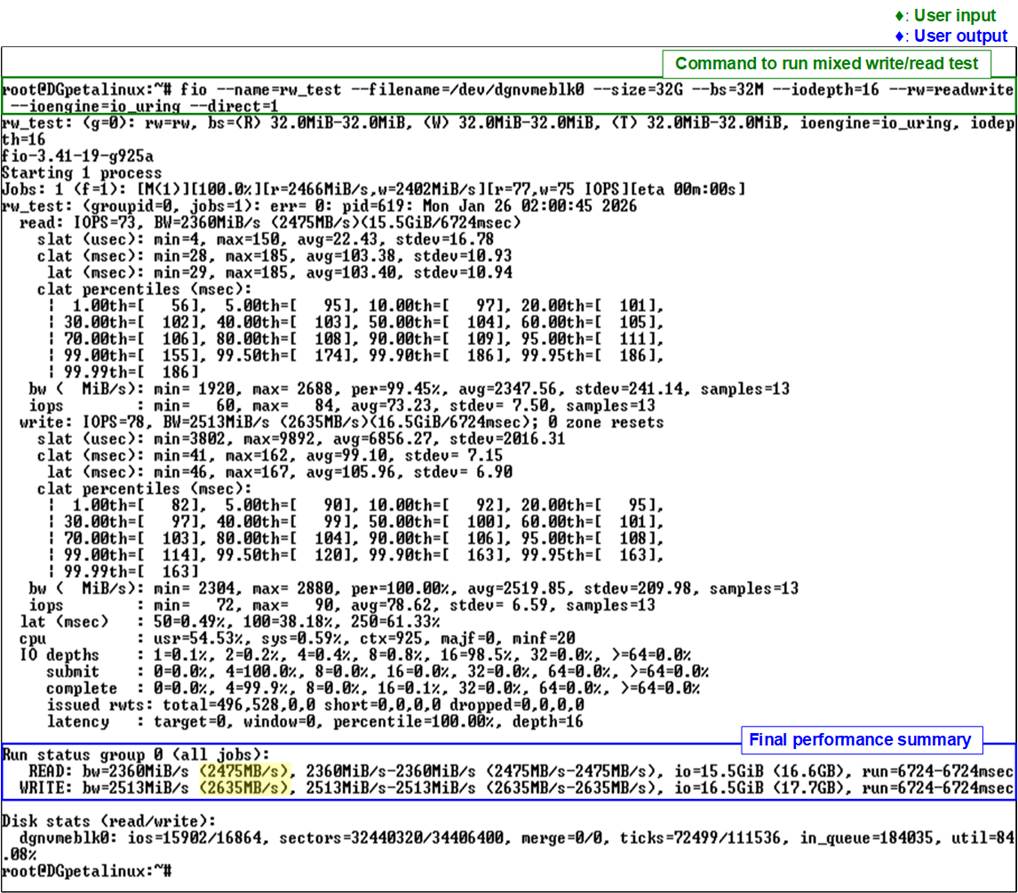
Figure 10 fio Mixed Read/Write Test (Gen4 Speed)
2.2 io-uring-perf Application
In this subsection, the io-uring-perf application provided by Design Gateway is used to evaluate raw data I/O performance. The application is based on the io_uring I/O engine and allows direct interaction with the NVMe block device to measure achievable throughput.
The test scenarios include Sequential Write, Sequential Read, and Mixed Write/Read operations. The application supports configurable parameters, enabling users to adjust test conditions and observe performance behavior under different workloads. An example of the command usage and supported options is shown in Figure 11.
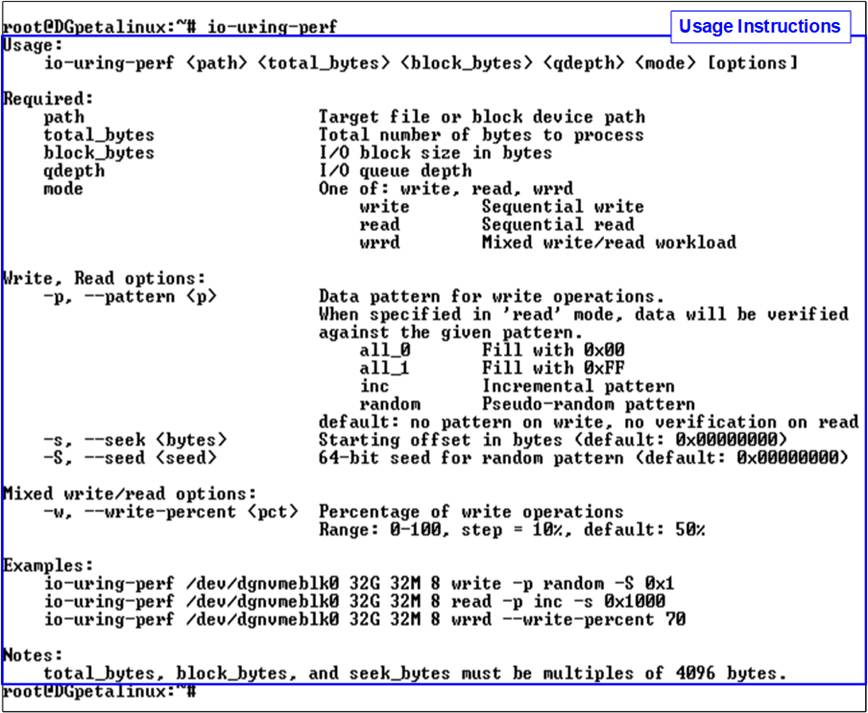
Figure 11 io-uring-perf Usage
2.2.1 Sequential Write
This test writes a total of 32 GB of data using a 32 MB block size and an I/O depth of 8. The workload performs a sequential write operation targeting the block device /dev/dgnvmeblk0. To achieve the best performance, an all-zero data pattern is used. The test is executed using the following command:
![]()
Figure 12 shows the result of the sequential write test executed with the io-uring-perf application. The upper portion of the figure displays the command execution and real-time progress output, while the lower portion presents the final performance summary. In this example, a write bandwidth of 6302.8 MB/s is achieved.
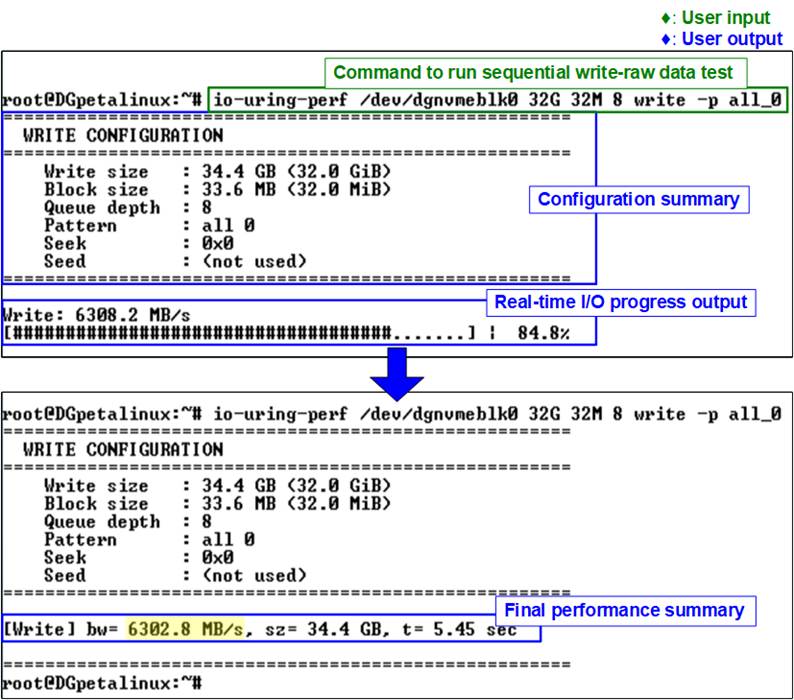
Figure 12 Sequential Write Test on io-uring-perf Application (Gen4 Speed)
In addition to the all-zero pattern, users can select other test data patterns—such as incremental pattern—to verify data correctness. When using an incremental pattern, write performance may be lower due to the increased CPU workload required to generate the data pattern.
For example, the following command writes 16 GB of data using a 32 MB block size and an I/O depth of 8 with an incremental data pattern:
![]()
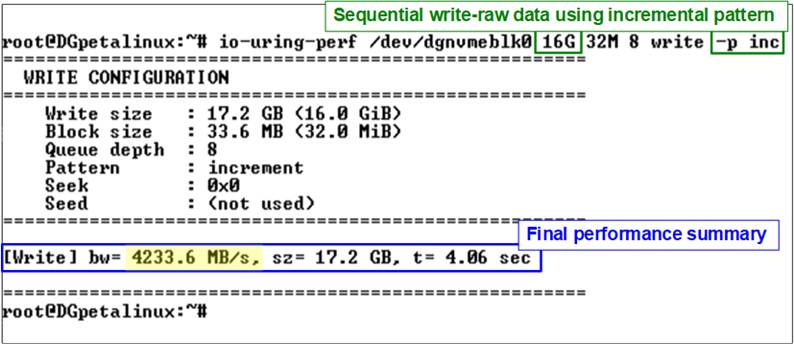
Figure 13 Sequential Write Test Using Incremental Pattern
Figure 13 shows the result of the sequential write test executed with the incremental pattern using the io-uring-perf application. In this case, the measured write bandwidth is 4233.6 MB/s, which is lower than that achieved with the all-zero pattern.
2.2.2 Sequential Read
This test reads a total of 32 GB of data using a 32 MB block size and an I/O depth of 8. The workload performs a sequential read operation targeting the block device /dev/dgnvmeblk0. To achieve the best performance, the read operation is executed without data verification. The test is executed using the following command:
![]()
Figure 14 shows the result of the sequential read test executed with the io-uring-perf application. The upper portion of the figure displays the command execution and real-time progress output, while the lower portion presents the final performance summary. In this example, a read bandwidth of 5358.8 MB/s is achieved.
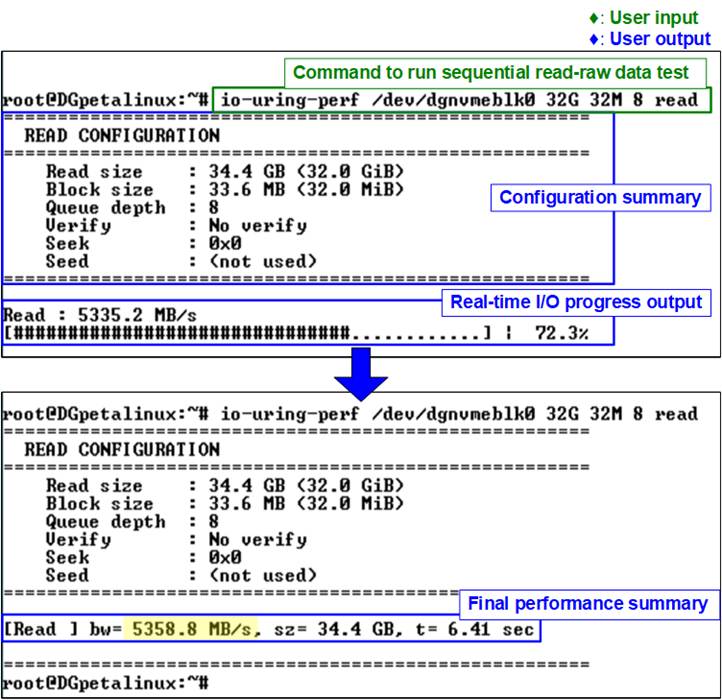
Figure 14 Sequential Read Test on io-uring-perf Application (Gen4 Speed)
To verify data correctness during read operations, users can enable data verification by specifying a test pattern, such as incremental pattern. Because additional CPU processing is required to generate and verify the data pattern, the measured read performance may be lower than that of a read operation without verification.
For example, the following command reads and verifies 16 GB of data using a 32 MB block size and an I/O depth of 8 with an incremental data pattern:
![]()
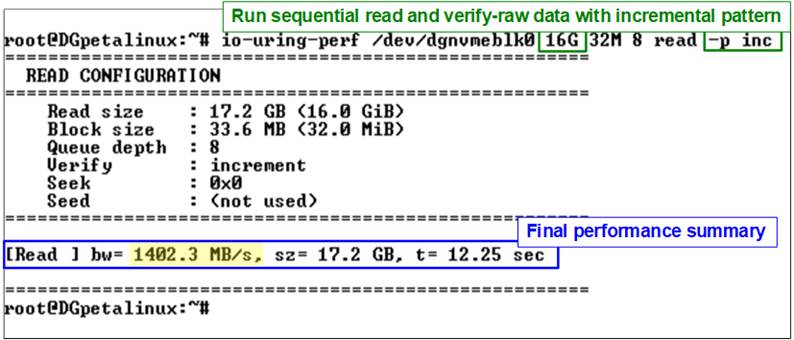
Figure 15 Sequential Read and Verification Test Using Incremental Pattern (Passed)
Figure 15 shows the result of the sequential read and verification test executed with the incremental pattern using the io-uring-perf application. In this case, the measured read bandwidth is 1402.3 MB/s, which is lower than the read bandwidth achieved without data verification.
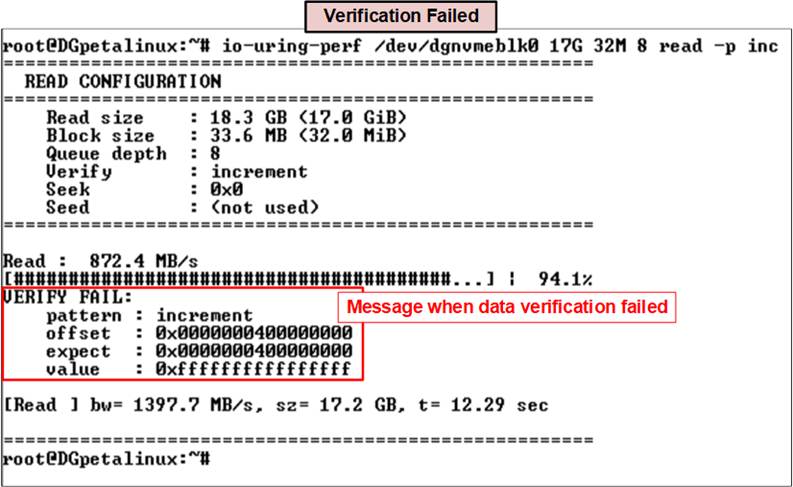
Figure 16 Sequential Read and Verification Test (Failed)
During data verification, if the received data does not match the expected value, an error message is displayed on the console. The message includes detailed information such as the error position, the expected value, and the actual read value, as shown in Figure 16.
For further analysis of verification failures, users can use the “hexdump” utility to display raw data stored in the target block device /dev/dgnvmeblk0. The following command dumps the first 512 bytes of data from the device in a human-readable format:
![]()
Figure 17 shows the output of the “hexdump” command displaying 512 bytes of data from the selected block device. Since no starting offset is specified, the dump begins at the lowest address of the device.
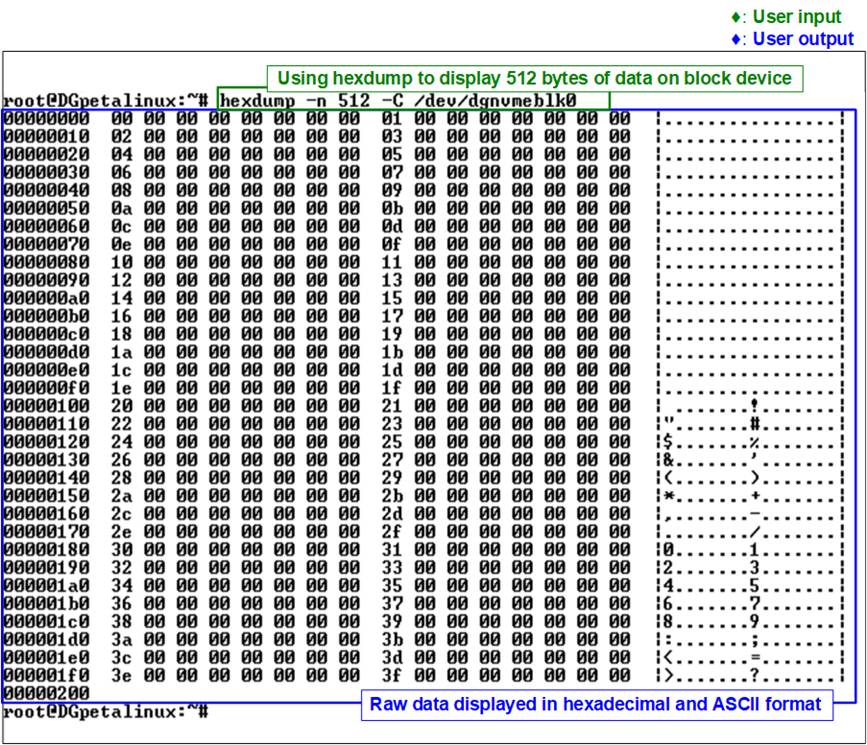
Figure 17 Dump Data Using “hexdump”
2.2.3 Mixed Write/Read
This test performs a mixed write/read workload with a total data size of 32 GB using a 32 MB block size and an I/O depth of 16. The workload executes a mixed write/read operation targeting the block device /dev/dgnvmeblk0. The test is executed using the following command:
![]()
Figure 18 illustrates the results of the mixed write/read test executed with the io-uring-perf application. The results report a write bandwidth of 2904.2 MB/s and a read bandwidth of 2904.2 MB/s.
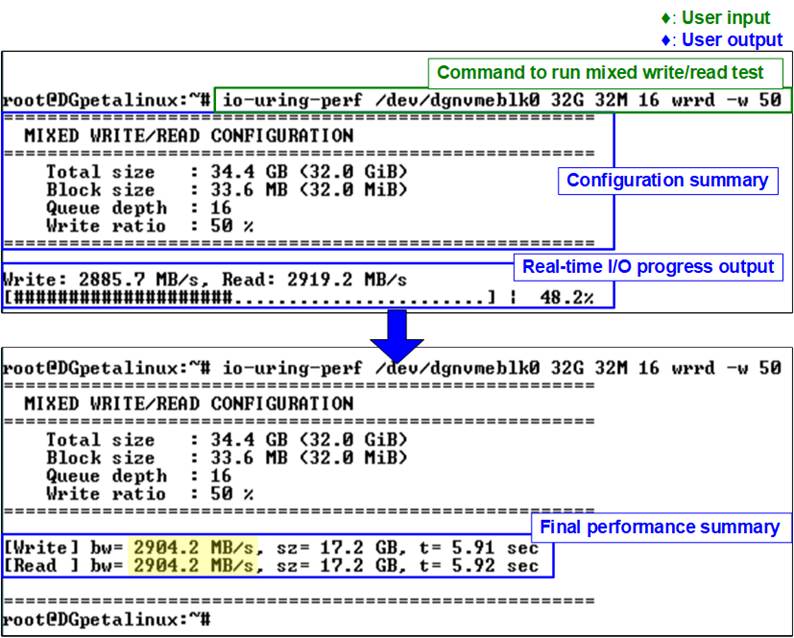
Figure 18 Mixed Read/Write Test on io-uring-perf Application (Gen4 Speed)
3 I/O Performance Test with Filesystem (ext4)
This section evaluates I/O performance at the filesystem level, taking filesystem overhead into account to better reflect real-world application behavior. The tests access data through the Linux VFS layer rather than directly through the raw block device and are performed using both the fio benchmark and the io-uring-perf application.
Before running the tests in this section, users should verify the I/O capabilities of the NVMe block device in the Linux system to ensure optimal performance, as described earlier and shown in Figure 5.
To perform filesystem-level I/O tests, the NVMe block device must first be formatted with a valid filesystem. This preparation step allows data to be accessed through the Linux file I/O interface instead of direct raw block access. Follow the steps below to prepare the device.
1) Run the following command to create an ext4 filesystem on the block device:
![]()
2) Confirm that the filesystem has been created successfully by running:
![]()
3) Create a directory to be used as the mount point:
![]()
4) Mount the formatted device to the created directory:
![]()
5) Verify that the device is properly mounted:
![]()
Figure 19 shows the result after formatting and mounting the device, confirming that it is ready for subsequent filesystem-level read and write performance tests.
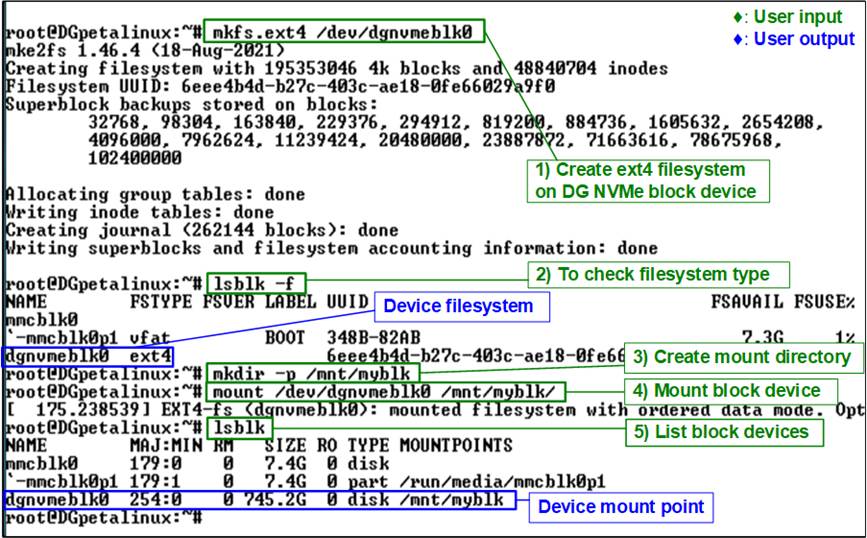
Figure 19 Create and Mount ext4
Filesystem on
Block Device
3.1 fio Benchmark
In this subsection, the fio benchmark is used to evaluate filesystem-level I/O performance. Unlike the raw device tests in Section 2, these tests access data through the mounted filesystem, thereby including filesystem and VFS overhead. The test scenarios include Sequential Write, Random Write, Sequential Read, and Random Read operations.
3.1.1 Sequential Write
This test writes a total of 32 GB of data using a 32 MB block size and an I/O depth of 8. The workload performs a sequential write operation using the io_uring I/O engine with direct I/O enabled, targeting a file located on the mounted filesystem at /mnt/myblk/. The test is executed using the following command:

Figure 20 shows the result of the sequential write test on the ext4 filesystem executed with the fio benchmark. The upper portion of the figure displays the command execution and real-time progress output, while the lower portion presents the final performance summary. In this example, a write bandwidth of 4126 MB/s is achieved.
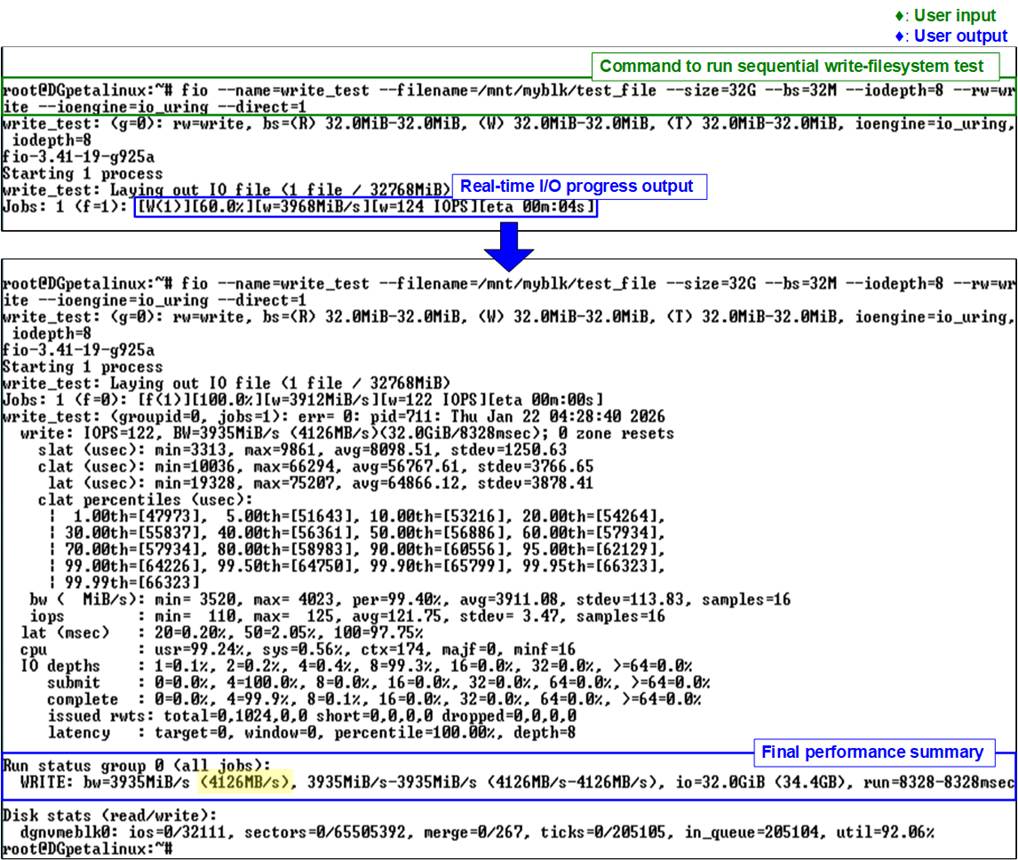
Figure 20 fio Sequential Write on Filesystem Test (Gen4 Speed)
3.1.2 Random Write
This test writes a total of 32 GB of data using a 32 MB block size and an I/O depth of 8. The workload performs a random write operation using the io_uring I/O engine with direct I/O enabled, targeting a file located on the mounted filesystem at /mnt/myblk/. The test is executed using the following command:

Figure 21 shows the result of the random write test on the ext4 filesystem executed with the fio benchmark. The upper portion of the figure displays the command execution and real-time progress output, while the lower portion presents the final performance summary. In this example, a write bandwidth of 4078 MB/s is achieved.
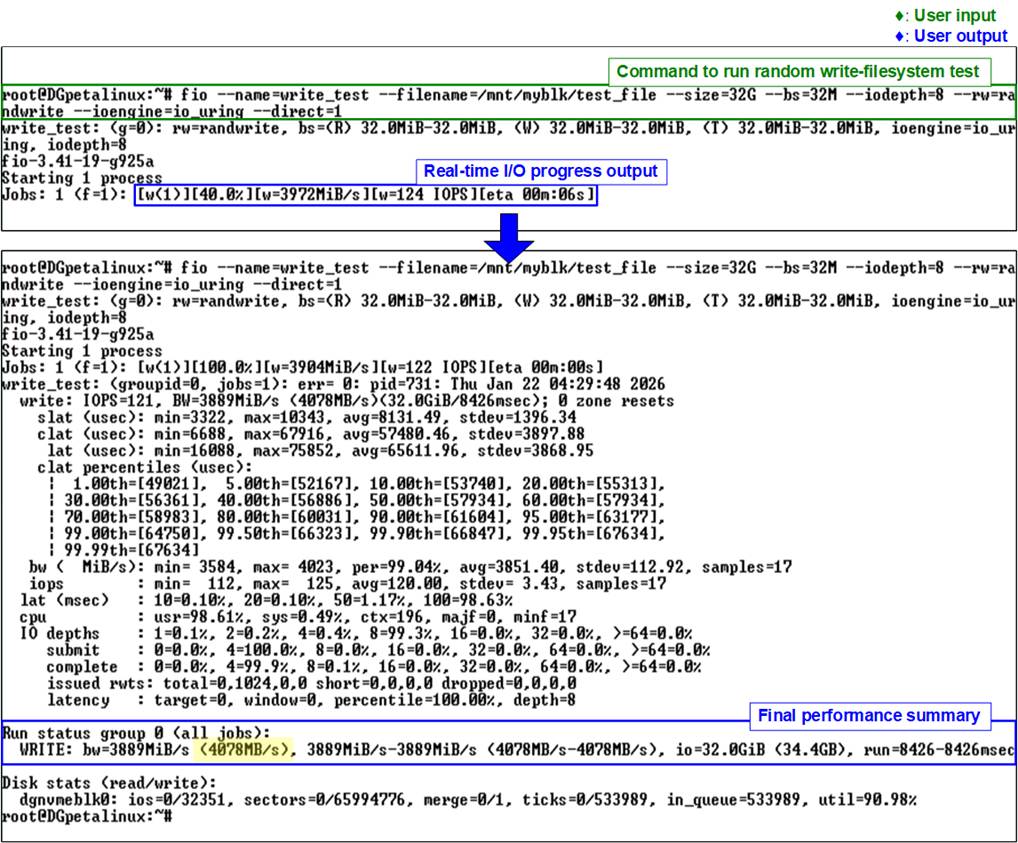
Figure 21 fio Random Write on Filesystem Test (Gen4 Speed)
3.1.3 Sequential Read
This test reads a total of 32 GB of data using a 32 MB block size and an I/O depth of 8. The workload performs a sequential read operation using the io_uring I/O engine with direct I/O enabled, targeting a file located on the mounted filesystem at /mnt/myblk/. The test is executed using the following command:

Figure 22 shows the result of the sequential read test on the ext4 filesystem executed with the fio benchmark. The upper portion of the figure displays the command execution and real-time progress output, while the lower portion presents the final performance summary. In this example, a read bandwidth of 5048 MB/s is achieved.
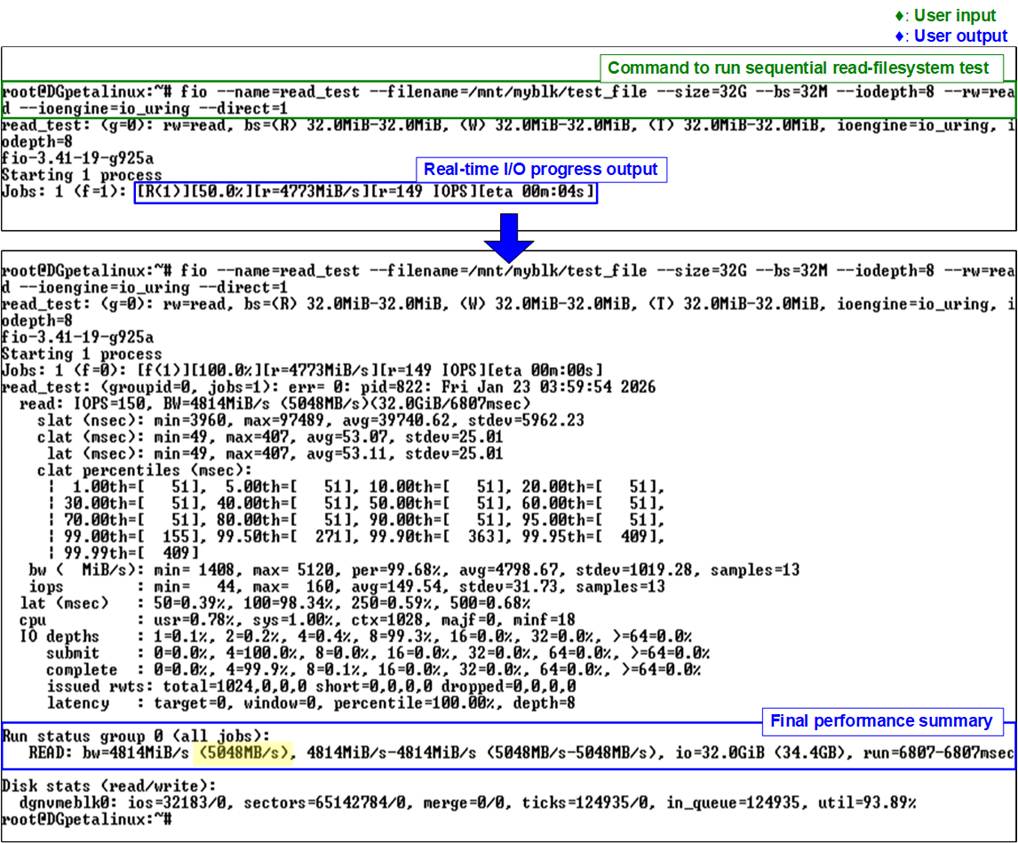
Figure 22 fio Sequential Read on Filesystem Test (Gen4 Speed)
3.1.4 Random Read
This test reads a total of 32 GB of data using a 32 MB block size and an I/O depth of 8. The workload performs a random read operation using the io_uring I/O engine with direct I/O enabled, targeting a file located on the mounted filesystem at /mnt/myblk/. The test is executed using the following command:

Figure 23 shows the result of the random read test on the ext4 filesystem executed with the fio benchmark. The upper portion of the figure displays the command execution and real-time progress output, while the lower portion presents the final performance summary. In this example, a read bandwidth of 5045 MB/s is achieved.
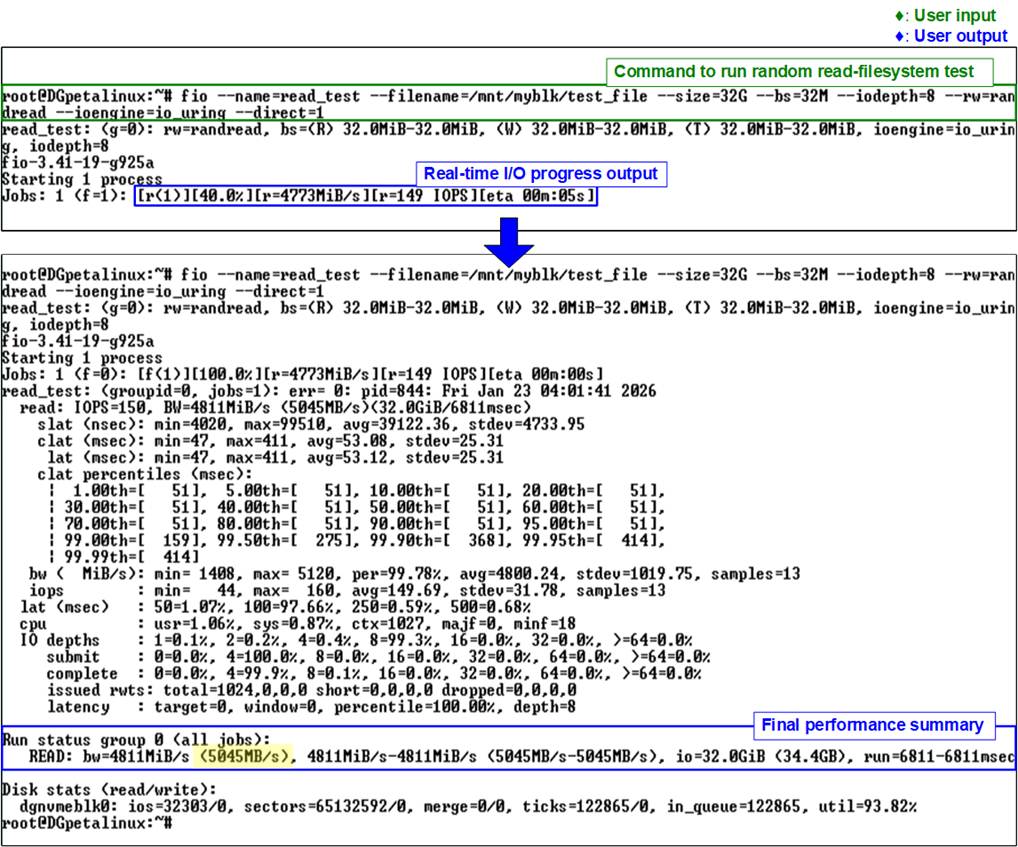
Figure 23 fio Random Read on Filesystem Test (Gen4 Speed)
3.1.5 Mixed Write/Read
This test performs a mixed write/read workload with a total data size of 32 GB using a 32 MB block size and an I/O depth of 16. The workload executes a mixed write/read operation using the io_uring I/O engine with direct I/O enabled, targeting a file located on the mounted filesystem at /dev/dgnvmeblk0. The test is executed using the following command:

Figure 24 illustrates the results of the mixed write/read test on the ext4 filesystem executed with the fio benchmark. The results report a write bandwidth of 2589 MB/s and a read bandwidth of 2432 MB/s.
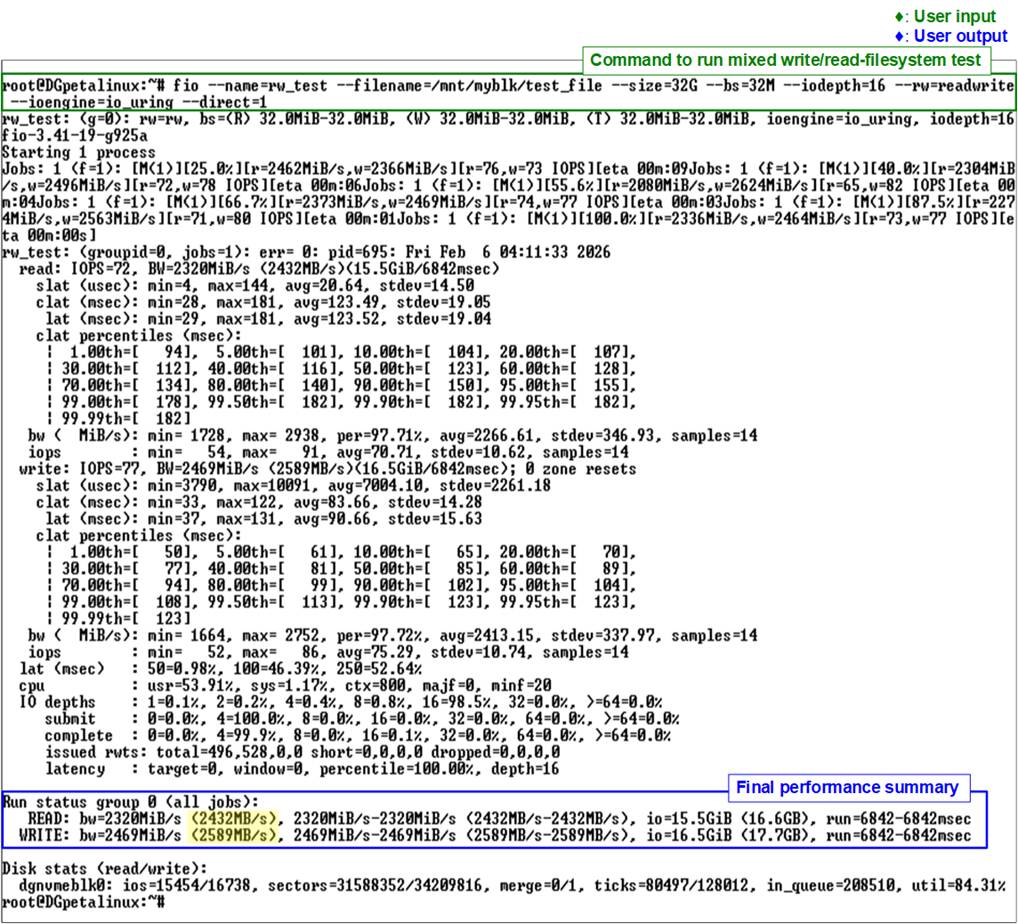
Figure 24 fio Mixed Read/Write on Filesystem Test (Gen4 Speed)
3.2 io-uring-perf Application
In this subsection, the io-uring-perf application provided by Design Gateway (DG) is used to evaluate filesystem-level I/O performance. The application is based on the io_uring I/O engine and accesses data through the mounted filesystem, thereby including filesystem and VFS overhead.
The test scenarios include Sequential Write, Sequential Read, and Mixed Write/Read operations. The application supports configurable parameters, allowing users to adjust test conditions and observe performance behavior under different workloads. An example of command usage is shown in Figure 11.
3.2.1 Sequential Write
This test writes a total of 32 GB of data using a 32 MB block size and an I/O depth of 8. The workload performs a sequential write operation targeting a file located on the mounted filesystem at /mnt/myblk/. The test is executed using the following command:
![]()
Figure 25 shows the result of the sequential write test on the ext4 filesystem executed with the io-uring-perf application. The upper portion of the figure displays the command execution and real-time progress output, while the lower portion presents the final performance summary. In this example, a write bandwidth of 6264.9 MB/s is achieved.
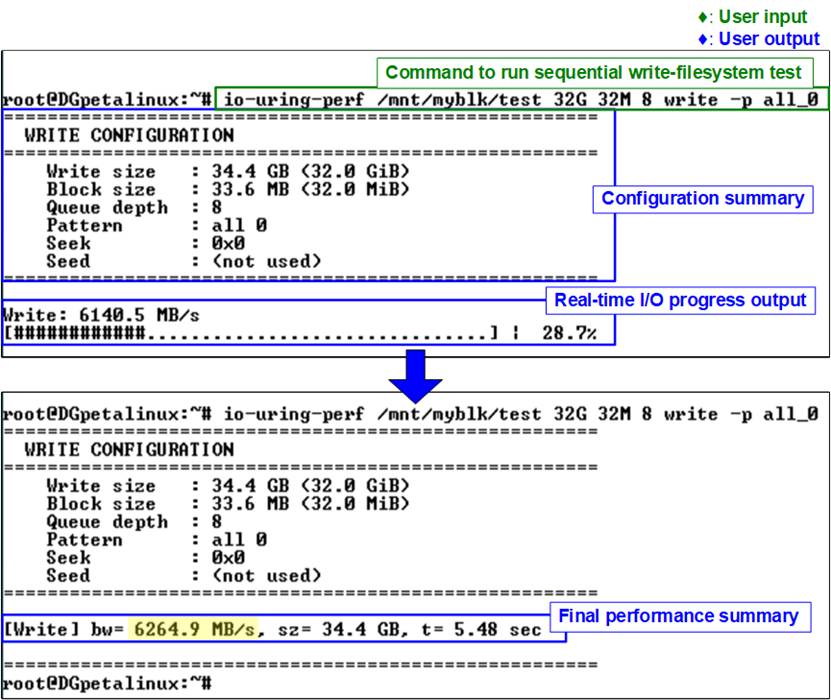
Figure 25 Sequential Write with Filesystem Test on io-uring-perf Application (Gen4 Speed)
3.2.2 Sequential Read
This test reads a total of 32 GB of data using a 32 MB block size and an I/O depth of 8. The workload performs a sequential read operation targeting a file located on the mounted filesystem at /mnt/myblk/. The test is executed using the following command:
![]()
Figure 26 shows the result of the sequential read test on the ext4 filesystem executed with the io-uring-perf application. The upper portion of the figure displays the command execution and real-time progress output, while the lower portion presents the final performance summary. In this example, a read bandwidth of 5303.6 MB/s is achieved.
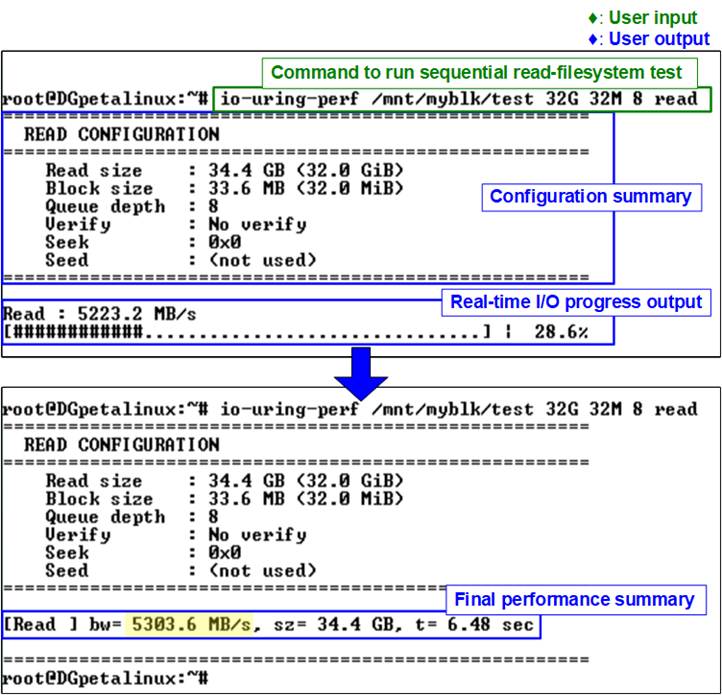
Figure 26 Sequential Read with Filesystem Test on io-uring-perf Application (Gen4 Speed)
3.2.3 Mixed Write/Read
This test performs a mixed write/read workload with a total data size of 32 GB using a 32 MB block size and an I/O depth of 16. The workload executes mixed write and read operations targeting a file located on the mounted filesystem at /mnt/myblk/. The test is executed using the following command:
![]()
Figure 27 illustrates the results of the mixed write/read test on the ext4 filesystem executed with the io-uring-perf application. In this example, both the write bandwidth and the read bandwidth reach 2613.8 MB/s.
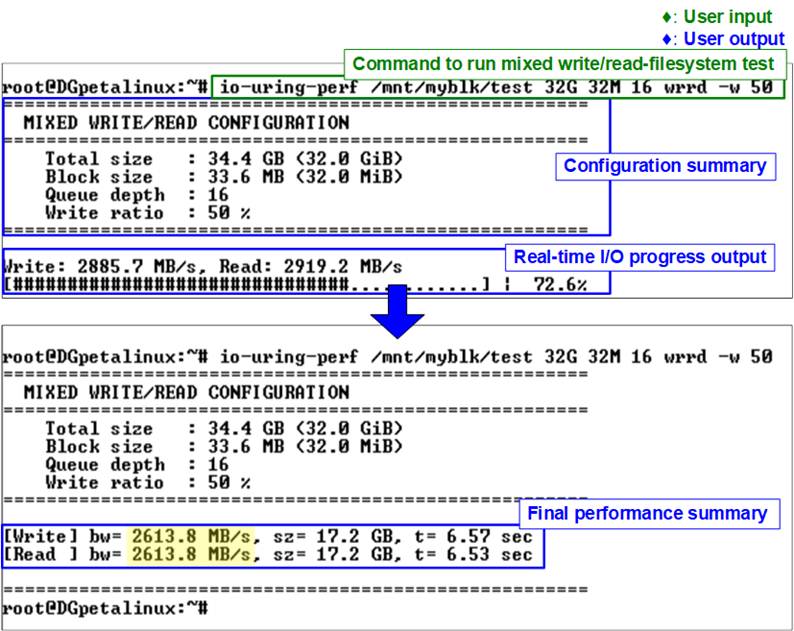
Figure 27 Mixed Read/Write with Filesystem Test on io-uring-perf Application (Gen4 Speed)
4 NVMe Management Commands Using DG NVMe Tool
Once the NVMe device is successfully initialized, users can proceed to run the test application “dgnvme”, which is used to execute various NVMe commands supported by the rmNVMe IP Core. A list of supported commands can be viewed by running “dgnvme help”, as shown in Figure 28.
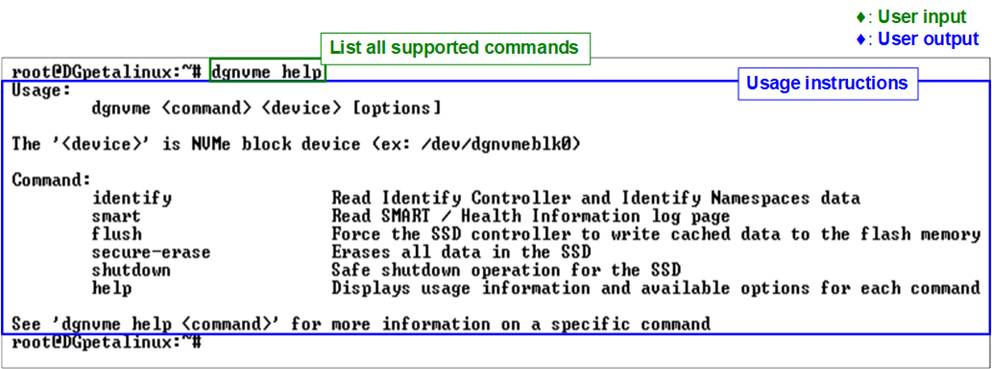
Figure 28 Help Command
· <command>: Specifies the operation to be performed on the NVMe device. Supported commands include
· identify : Displays device identification data in either decoded or raw format.
· smart : Displays SMART health information.
· flush : Forces cached data to be written to the device.
· secure-erase : Issues a Secure Erase command.
· shutdown : Safely powers down the device.
· help : Displays usage information and available options for each command.
· <device>: Specifies the NVMe device file to be accessed. In this demo, the driver is preloaded into the Linux kernel, so no manual insertion is required. The device can typically be accessed via “/dev/dgnvmeblk0”.
· [options]: Additional parameters that may be required depending on the command. Some commands support multiple options such as operation modes, offsets, or lengths. These parameters allow users to customize the behavior of the command. For detailed information about the available options, enter “dgnvme help <command>”. For example, “dgnvme help identify” displays all supported options for the Identify command.
4.1 Identify Command
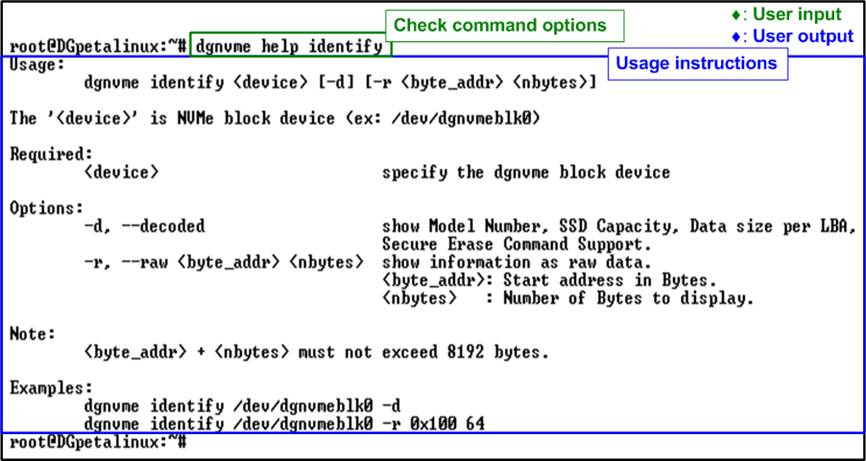
Figure 29 Identify Command Options
The Identify command is used to retrieve identification data from the NVMe block device. As shown in Figure 29, this command provides two output formats for displaying the retrieved data.
Decoded Output Format
The decoded format presents the identify data in a human-readable structure. It extracts and displays key information about the NVMe device, as illustrated in Figure 30.
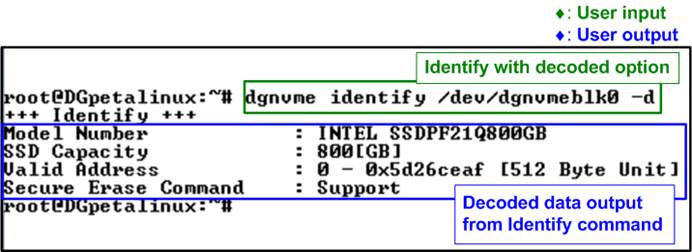
Figure 30 Decoded Mode of Identify Command
The displayed information includes the following items:
· Model Number: Decoded from the Identify Controller data, indicating the model of the device.
· SSD Capacity: Provided by the rmNVMe-IP, indicating the total usable storage capacity of the device.
· Valid Address: Provided by the rmNVMe-IP, indicating the address range accessible by the host.
· Secure Erase Command: Decoded from the Identify Controller data, indicating whether the device supports the Secure Erase feature.
Raw Data Format
The raw format displays the identify data as a hexadecimal output. This command syntax is as follows:
![]()
· byte_addr specifies the starting byte address of the Identify data.
· nbytes defines the number of bytes to be read.
The maximum amount of data that can be retrieved with this command is 8 KB. The first 4 KB contains the “Identify Controller Data Structure”, and the remaining 4 KB contains the “Identify Namespace Data Structure”. Therefore, the sum of “byte_addr” and “nbytes” must not exceed 8192 bytes. If this limit is exceeded, the command returns an error message.
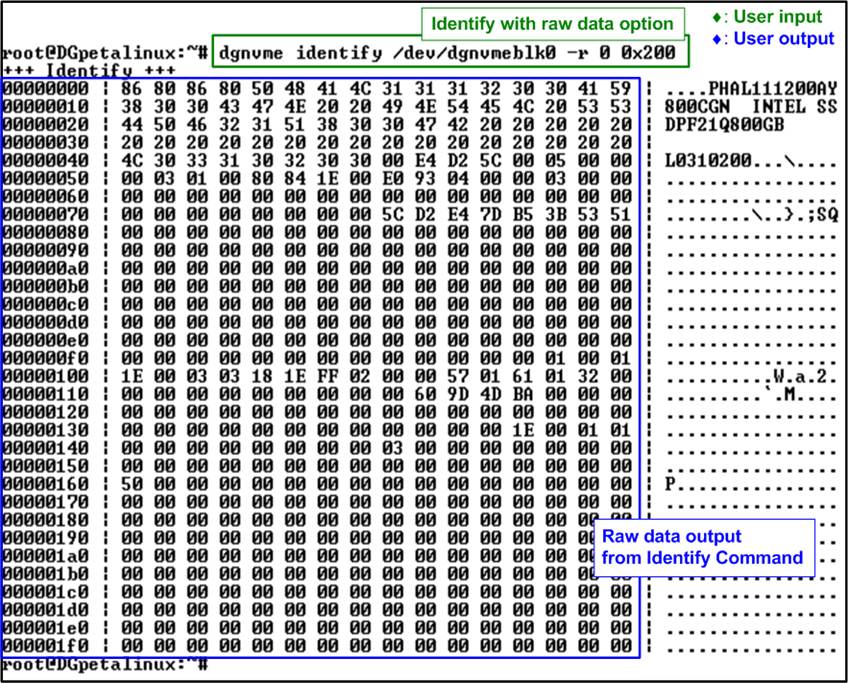
Figure 31 Raw Data Mode of Identify Command
4.2 SMART Command
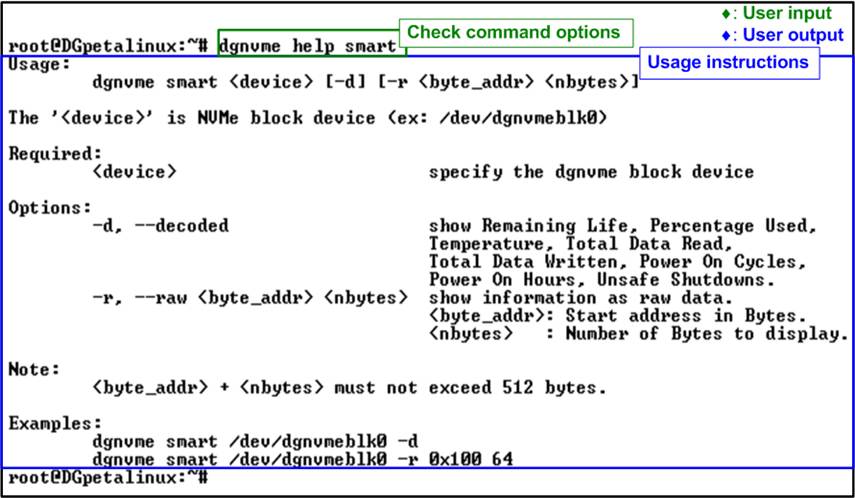
Figure 32 SMART Command Options
The SMART command is used to retrieve health and diagnostic information from the NVMe block device. As shown in Figure 32, this command provides two output formats for displaying the retrieved data, similar to the Identify command.
Decoded Output Format
The decoded format presents the SMART data in a human-readable structure. It extracts and displays health information of the NVMe block device, as illustrated in Figure 33.
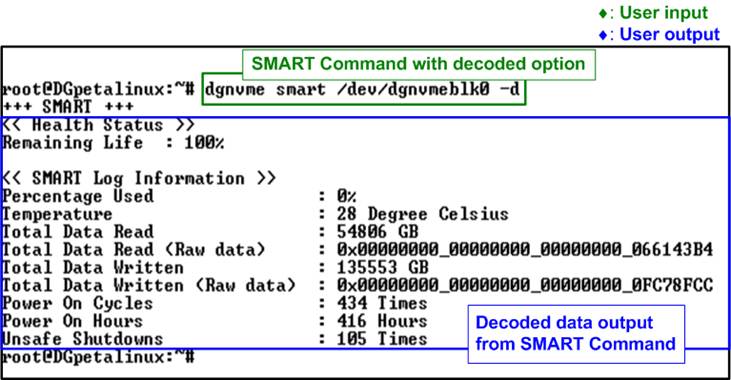
Figure 33 SMART Command Decoded Mode
The Health status displays the remaining life of the device as a percentage, derived from the “Percentage Used” field in the SMART log. The decoded SMART data includes the following seven parameters:
· Percentage used : Indicates the portion of the device’s lifespan that has been consumed, expressed as a percentage.
· Temperature : Displays the current operating temperature of the device in degrees Celsius.
· Total Data Read : Shows the cumulative amount of data read from the device, displayed in GB/TB units. The raw data is also provided as a 32-digit hex number (128 bits), where each unit represents 512,000 bytes.
· Total Data Written : Shows the cumulative amount of data written to the device, displayed in GB/TB units. The raw data is also provided as a 32-digit hex number (128 bits), where each unit represents 512,000 bytes.
· Power On Cycles : Reports the total number of times the device has been powered on.
· Power On Hours : Reports the total number of hours the device has been powered on.
· Unsafe Shutdowns : Represents the number of times the device has experienced an unsafe shutdown.
Raw Data Format
The raw format displays the SMART data as a hexadecimal output. This command syntax is as follows:
![]()
· byte_addr specifies the starting byte address of the SMART data.
· nbytes defines the number of bytes to be read.
The maximum amount of data that can be retrieved with this command is 512 bytes. Therefore, the sum of “byte_addr” and “nbytes” must not exceed 512 bytes. If this limit is exceeded, the command returns an error message.
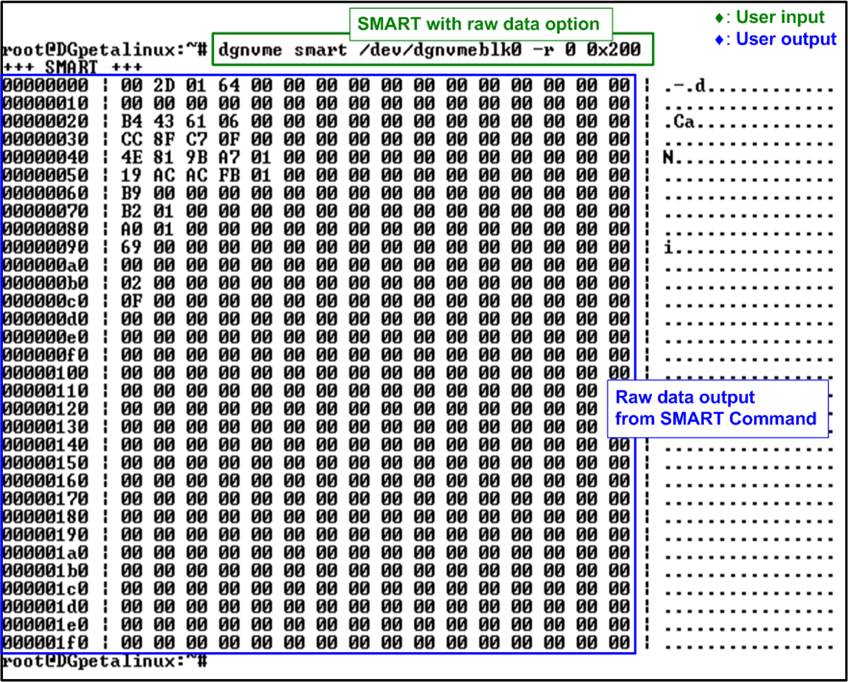
Figure 34 Raw Data Mode of SMART
Command
4.3 Flush Command
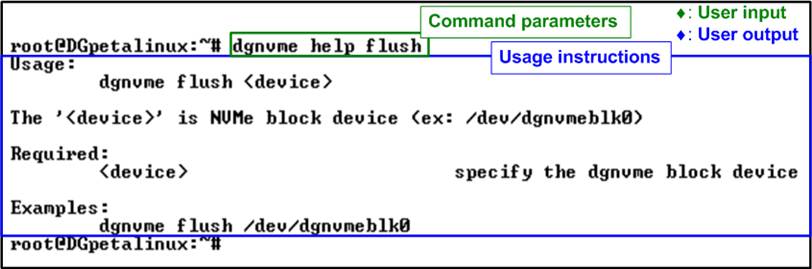
Figure 35 Flush Command Execution (No Options Required)
The Flush command ensures that all data currently stored in the device’s cache is properly written to non-volatile flash memory. This operation helps prevent data loss in the event of an unexpected power-down. The command does not require any additional options; users only need to specify the target device, as shown in Figure 35.
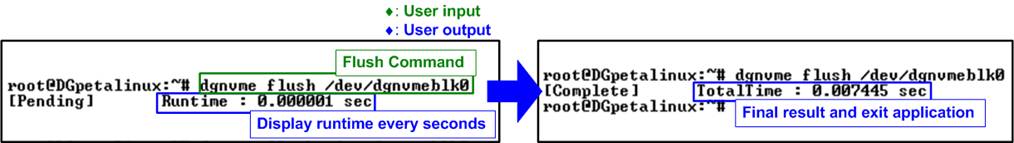
Figure 36 Flush Command Result
During execution of the Flush command, the console displays the total runtime, which is updated every second. After the operation completes, the final execution time is reported, as illustrated in Figure 36.
4.4 Secure Erase Command
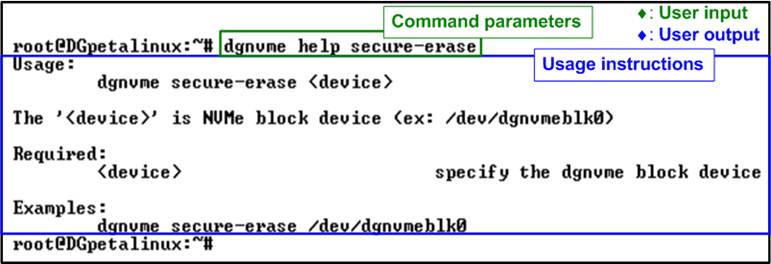
Figure 37 Secure Erase Execution (No Options Required)
The Secure Erase command permanently deletes all user data on the device by initiating a secure erase operation. This operation is irreversible. Depending on the device model and capacity, this process may take a long time to complete. The command does not require any additional options; users only need to specify the target device, as shown in Figure 37.
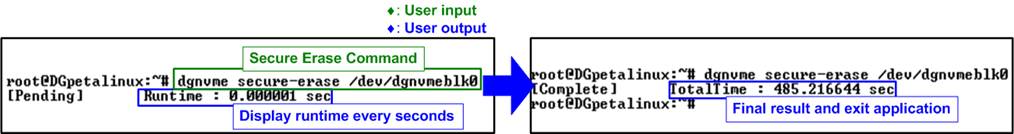
Figure 38 Secure Erase Result
During execution of the Secure Erase command, the console displays the total runtime, which is updated every second. Upon completion, the final execution time is shown, as illustrated in Figure 38.
4.5 Shutdown Command
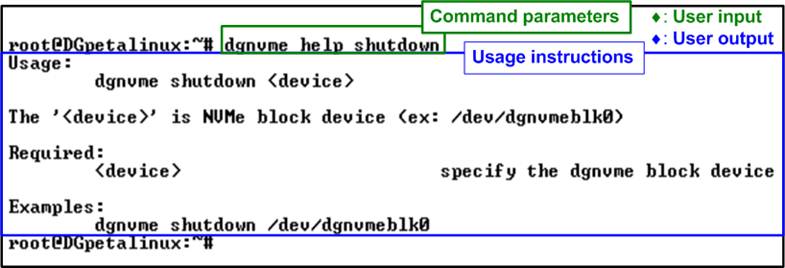
Figure 39 Shutdown Command Execution (No Options Required)
The Shutdown command is used to safely power down the NVMe block device. It ensures that all cached data is flushed to non-volatile memory and the device transitions to an inactive state without risk of data corruption. Once shut down, the device no longer responds to commands until the system is rebooted and the drive is reinitialized.
Before executing the Shutdown command, ensure that the block device is not in use. If the device is mounted, it must be unmounted first. In addition, the Shutdown command should be executed only before unloading the driver or powering off the system.
The command does not require any additional options; users only need to specify the target device, as shown in Figure 39.
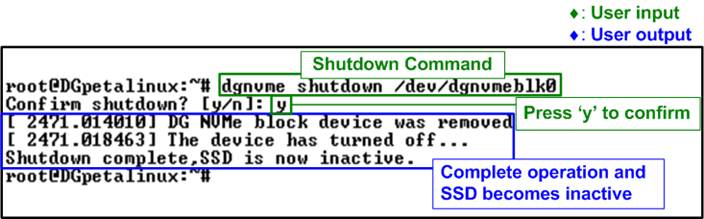
Figure 40 Shutdown Command Result
After entering the Shutdown command, the system prompts for confirmation, as shown in Figure 40. To proceed, the user must type “y”. Once confirmed, the Shutdown command is issued to initiate the power-down process.
Upon successful completion, the application displays a message indicating that the device is now inactive. At this stage, the device is removed from the kernel and becomes inaccessible. As a result, no further test operations can be performed until the system is restarted and the NVMe block device is re-initialized.
This behavior is illustrated in Figure 41, where the device is no longer detected after the shutdown operation completes.
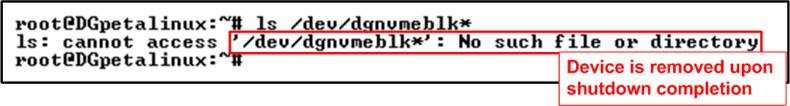
Figure 41 Device Removed After Shutdown Completes
5 User Application Execution via Ethernet Interface
This section demonstrates how to develop, transfer, and execute a cross-compiled user application on the target FPGA board through the Ethernet interface. This workflow allows users to validate their own applications and evaluate system behavior in a real hardware environment prior to purchase.
Any user-developed application, such as file-I/O tools, data-logging programs, or performance benchmarks, can be compiled and executed using the same procedure.
Applications should be cross-compiled on the host PC using the “aarch64-linux-gnu-gcc” toolchain.
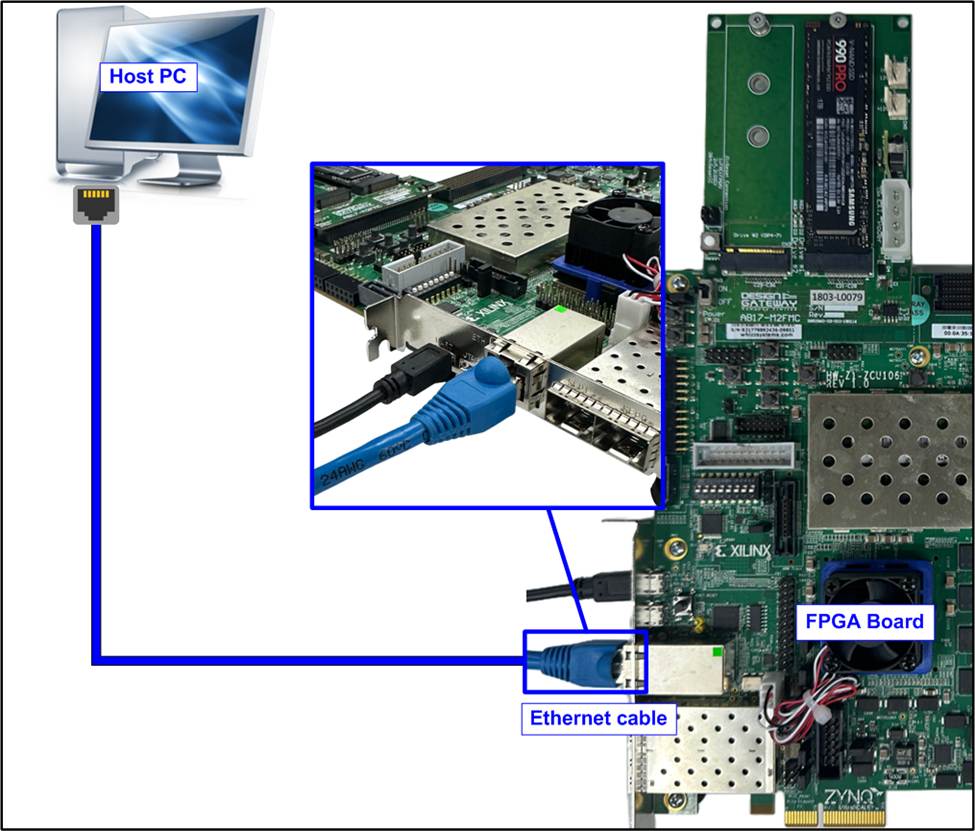
Figure 42 Ethernet Connection Setup
Before transferring files over the network, ensure that an Ethernet cable is connected between the target FPGA board and the host PC to establish a direct network connection, as illustrated in Figure 42.
5.1 Configure Ethernet Interface
To enable communication between the host PC and the FPGA board, configure the Ethernet interface as follows:
1) Disable the Ethernet interface:
![]()
2) Reconfigure and re-enable the Ethernet interface with a static IP address and subnet mask:
![]()
3) Verify the configuration to ensure that the “eth0” interface is active and assigned to the correct IP address:
![]()
Figure 43 shows an example of the Ethernet interface configured with a static IP address.
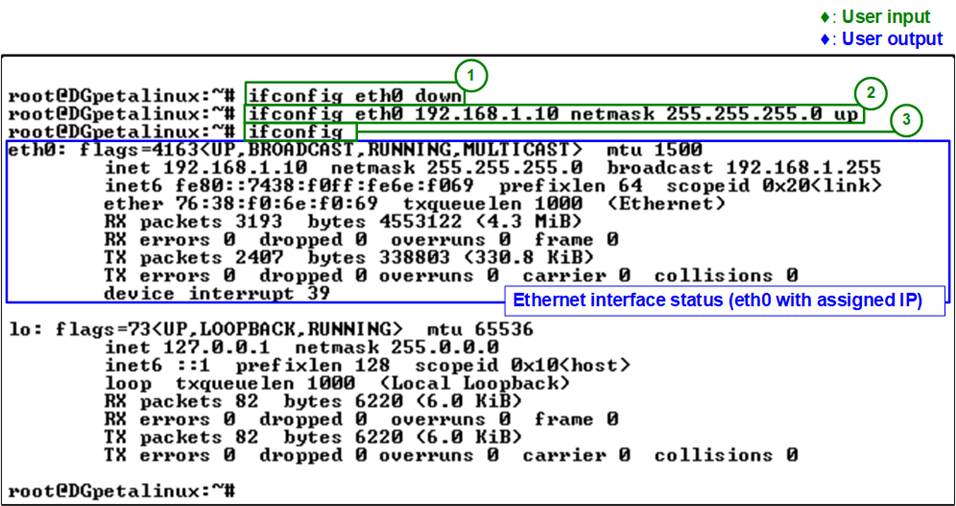
Figure 43 Ethernet Interface Setup
5.2 Transfer the Executable File
After configuring the Ethernet interface, verify network connectivity and transfer the cross-compiled executable from the host PC to the target FPGA board via the Ethernet interface. Follow the steps below:
1) Verify network connectivity using the “ping” command to confirm that the target board is reachable. In this demo, the target board IP address is 192.168.1.10.
![]()
If the connection is successful, the terminal displays reply messages from the target board.
2) Stop the ping process by pressing “Ctrl+C”.
3) Navigate to the directory containing the executable file using the “cd” command to change to the directory where the executable file is located. In this example, the io_uring-test executable is included in the demo package:
![]()
4) Transfer the executable file using the “scp” command to securely copy the executable to the target board:
![]()
5) Confirm the SSH connection if this is the first connection to the target board by typing “yes”. This prompts for confirmation to add the device to the known hosts list.
![]()
6) When prompted, enter the password for the target board (default password: root). The file transfer will begin after successful authentication.
![]()
Once the transfer completes, the terminal displays the transfer status, confirming that the executable has been successfully copied to the target FPGA board.
Figure 44 shows the network connectivity check and successful file transfer.
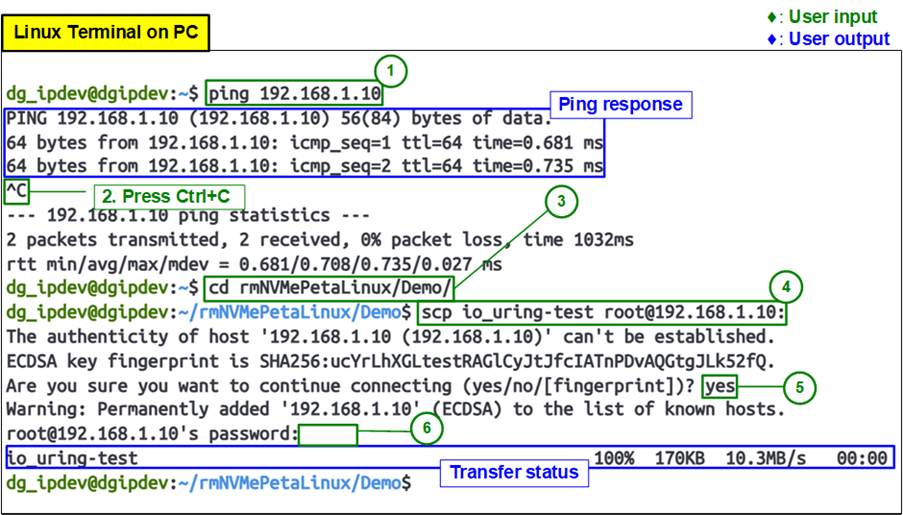
Figure 44 Host Terminal: Network Check and File Transfer
5.3 Execute User Application
After transferring the executable file, run the program on the target FPGA board from the Serial console using the following command:
![]()
The program output displays the number of I/O submissions and completions, confirming that the test has executed successfully on the target device, as illustrated in Figure 45.
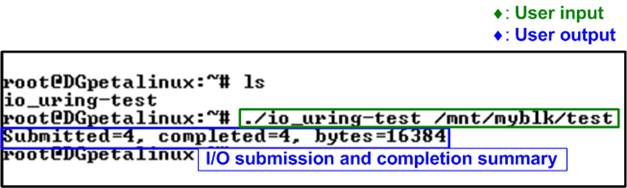
Figure 45 Run Cross-compiled Application on Target Board
Note: The “io_uring-test” application is an example program designed to utilize the “io_uring” I/O engine for high-performance I/O operations. In this demo, it is used to validate file access through the mounted filesystem on the NVMe block device. The source code for this example is available at:
https://github.com/axboe/liburing/blob/master/examples/io_uring-test.c
6 Revision History
|
Revision |
Date (D-M-Y) |
Description |
|
1.01 |
11-Feb-26 |
Support Gen4 speed and add io-uring-perf application |
|
1.00 |
14-Nov-25 |
Initial version release |