Measuring Latency Time
System Architecture
From last post, you already know what latency time is and how it is important to you. However, you may curious that how to measure latency time, if you are doing a project, which part of your project can be possible to reduce the latency. In this case, we will demonstrate latency time in 2 cases which are software application and hardware application, which we are focusing on network application.
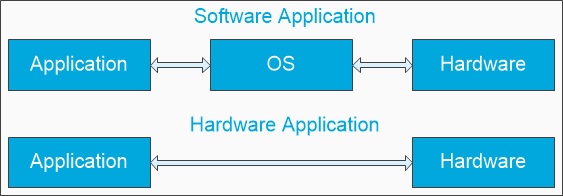
At first, we will look at architecture of software application and hardware application. Normally software application is consist of 3 blocks which are application function, Operating System and hardware (Network card). Let us look at Hardware application on FPGA, mostly, it contains only 2 blocks which are application and hardware.
Latency time could happen at every block of the application. As it is noticeable, there is no OS block on hardware application, if you are really concern about latency. It can reduce latency time due to OS management in hardware application.
How to measure latency time?
On Software application, when talking about latency time on network application, we will measure it by sending a packet from client to sever and wait for the response from server back to client, measured in millisecond (ms). That period of time is called Round-trip time (RTT). There is famous software to measure network’s parameters named Iperf. It is able to measure speed, latency time, bandwidth and etc.
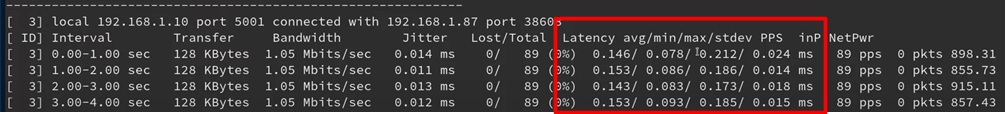
From the picture, Iperf is transferring UDP packet between server and client. It shows average, minimum, maximum and standard deviation of latency time from amount of packets in the period of time.
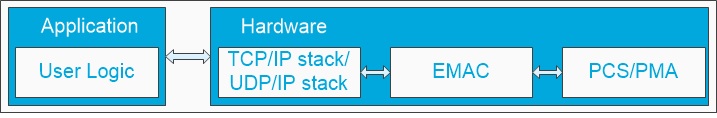
On hardware application, we should understand the detail in each block of hardware application before we measure the latency time. From picture above, the application is equal to the user logic in hardware application and the hardware block is consisting of 3 sub-blocks which are TCP or UDP / IP stack, EMAC and PCS/PMA.
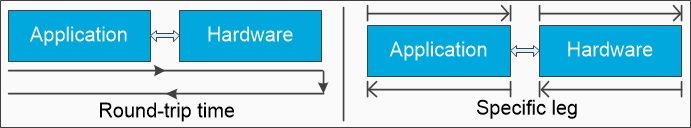
In General, We can measure the latency time of hardware application in 1 method which is Round-trip time as in software application. However, if customers are focusing on specific leg, either sending or receiving, some IP-core providers can give you a specific latency in each section. Let’s look at some example of latency measurement in each block.
TCP/IP or UDP/IP protocol stack
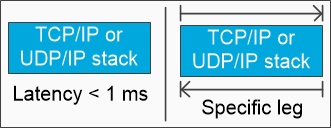
The latency time measurement is depended on IP-core provider, some might just say that guarantee latency time is less than 1 microsecond. It is not giving you a detail in each path. However, some IP-provider can show the latency time for both sending and receiving path such as Design Gateway, which latency time is extremely low.
EMAC
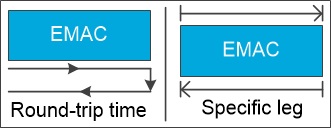
In this block, it can give you a latency time for sending path and receiving path by measuring data before going into the block and when it comes out of the block as illustrate in the picture above. However, there are some IP-core providers still giving a latency time in RTT form.
PHY
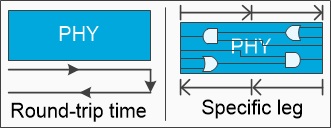
Latency time of PHY might measure by RTT as per usual. However, there is some manufacturers give customer a latency time in each circuit inside the chip. Then, user has to calculate the latency time themselves from their configuration.
Conclusion
After all, hardware application can provide a lower latency time than a software application by measuring it either round-trip time or specific leg. Therefore, if your project considers latency time as a priority, you should design project on only hardware. And if you are looking for low latency IP-core, please visit our website https://dgway.com/ASIP_E.html
Next, we will look deeply in hardware application especially, EMAC block.